Features
A new concept in Machine Condition Monitoring
Web Interface
TWave T8 includes an embedded web interface for configuration and data visualization. Its friendly and intuitive Dashboard is composed of multiple Desktops.
Data is shown in Widgets, whose size and position (desktop layout) is fully customizable for each user.
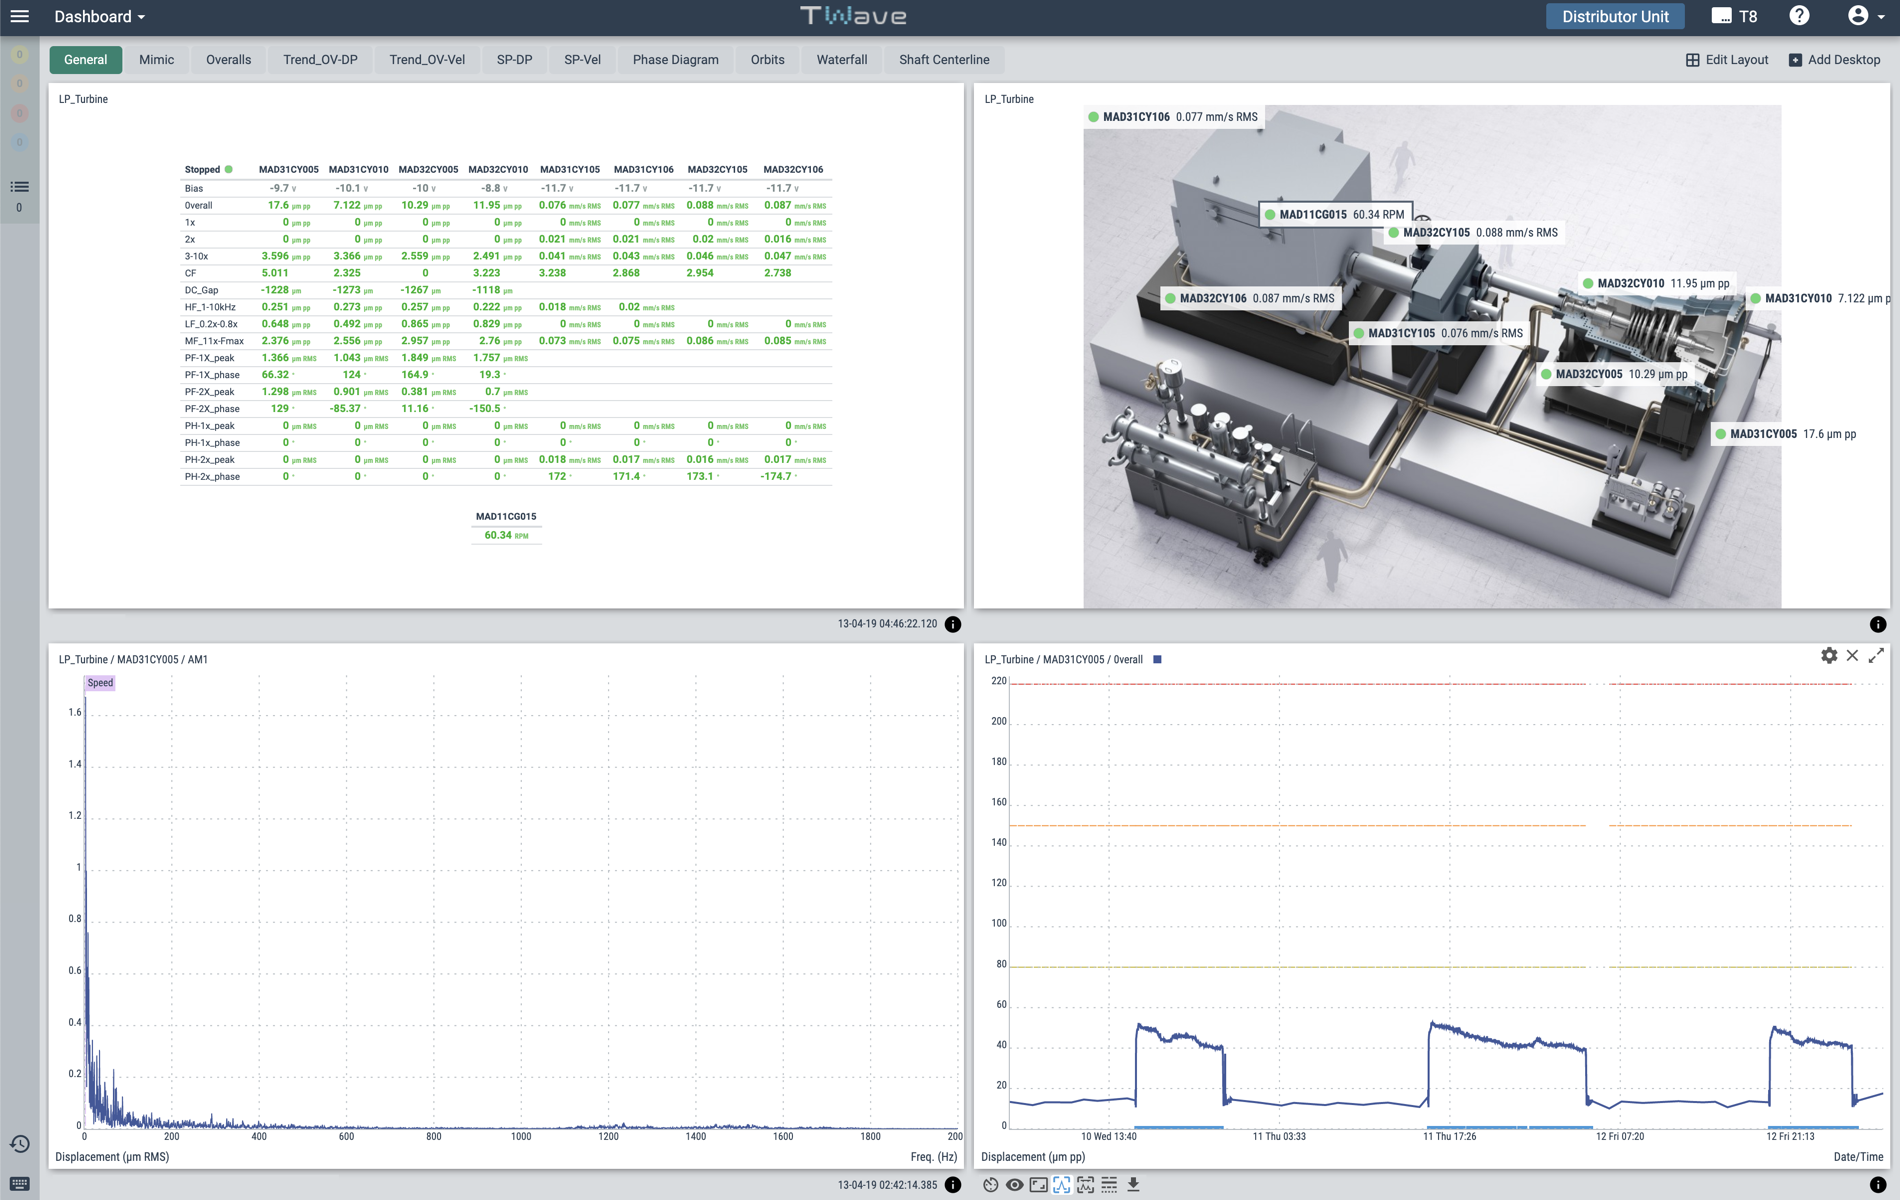
Dashboard
The Dashboard visualizes the real time measurements performed by the TWave T8 module. It also shows the historical data stored in the unit.
Widgets
Data is shown in different types of Widgets. Each of them provides specific analysis and diagnosis tools.
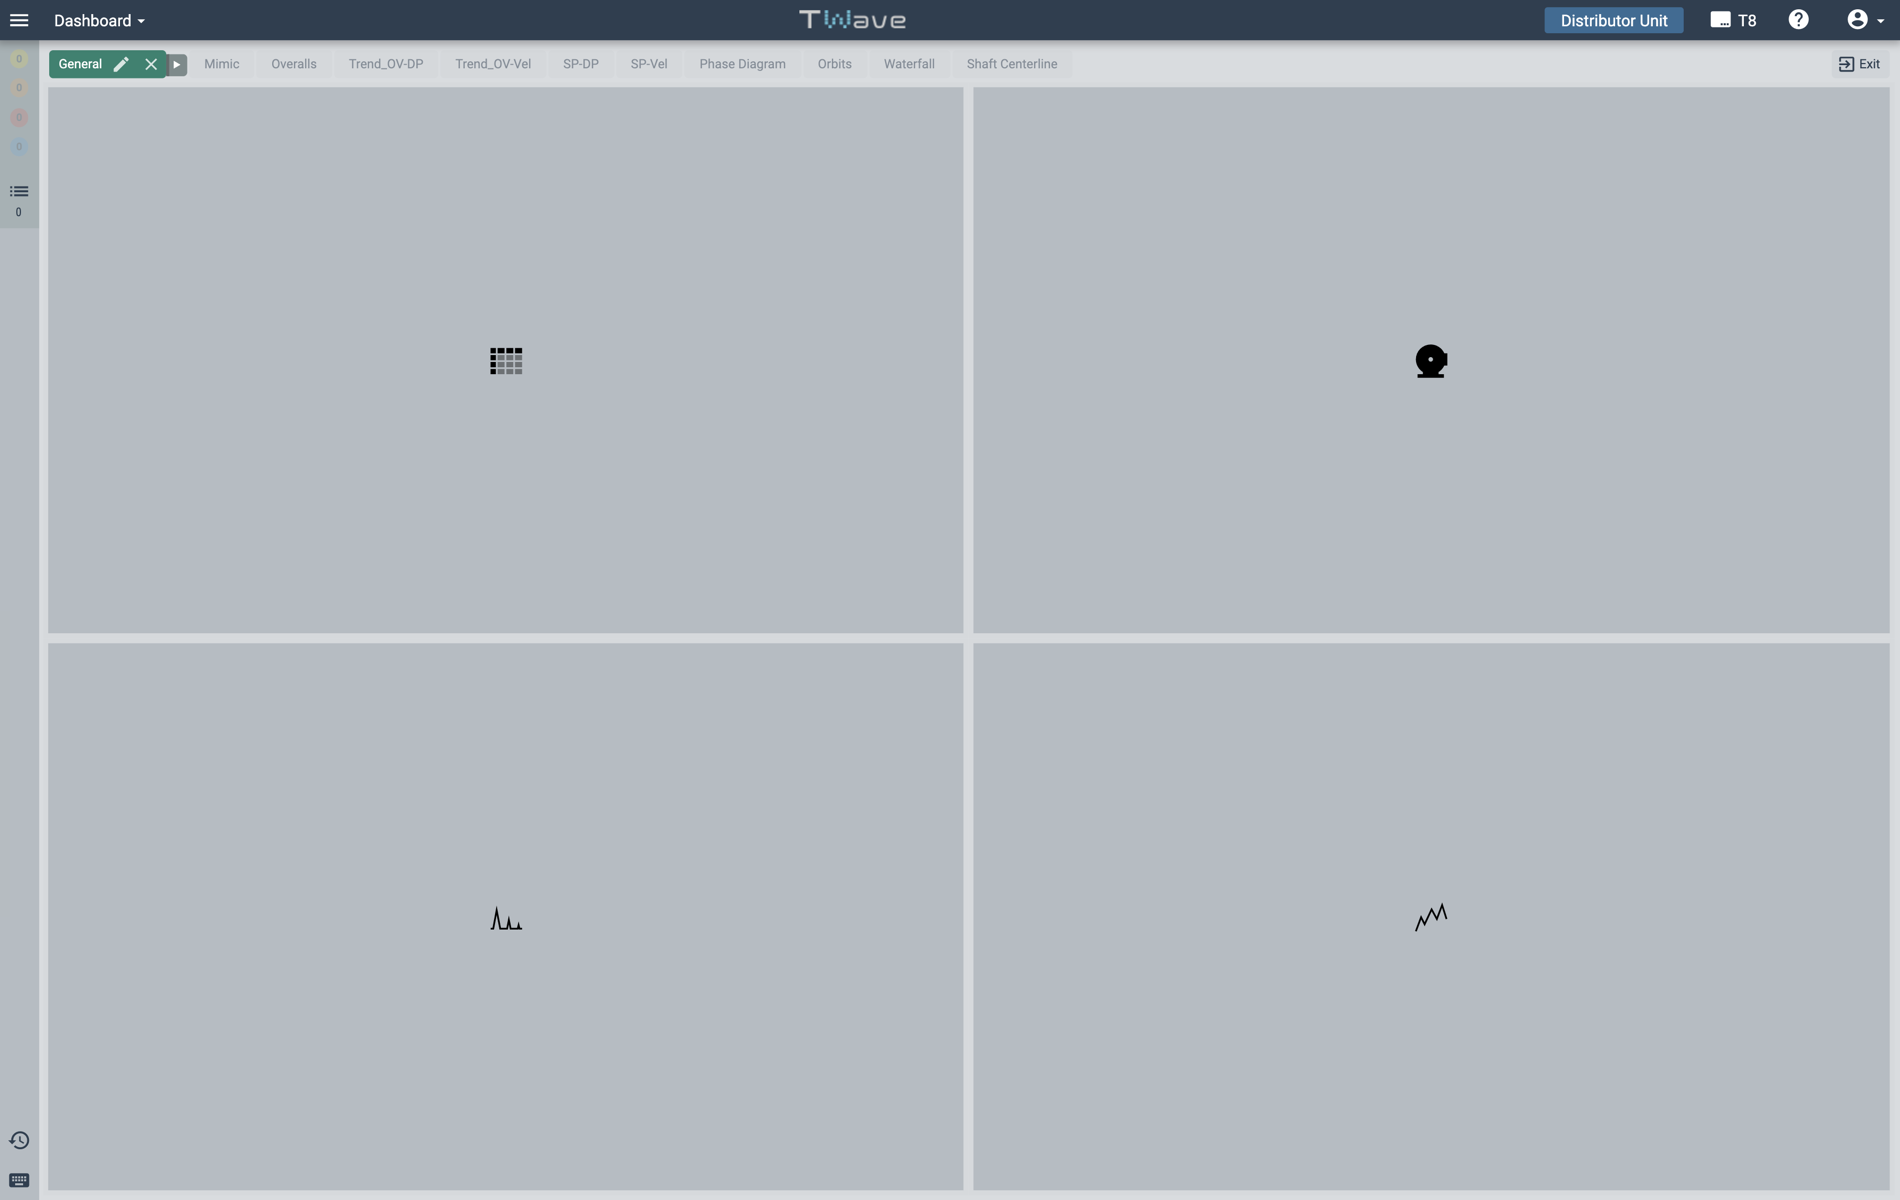
Layouts
Desktop layouts can be easily defined by creating over the interface the space for each Widget. Size and position can be modified at any time.
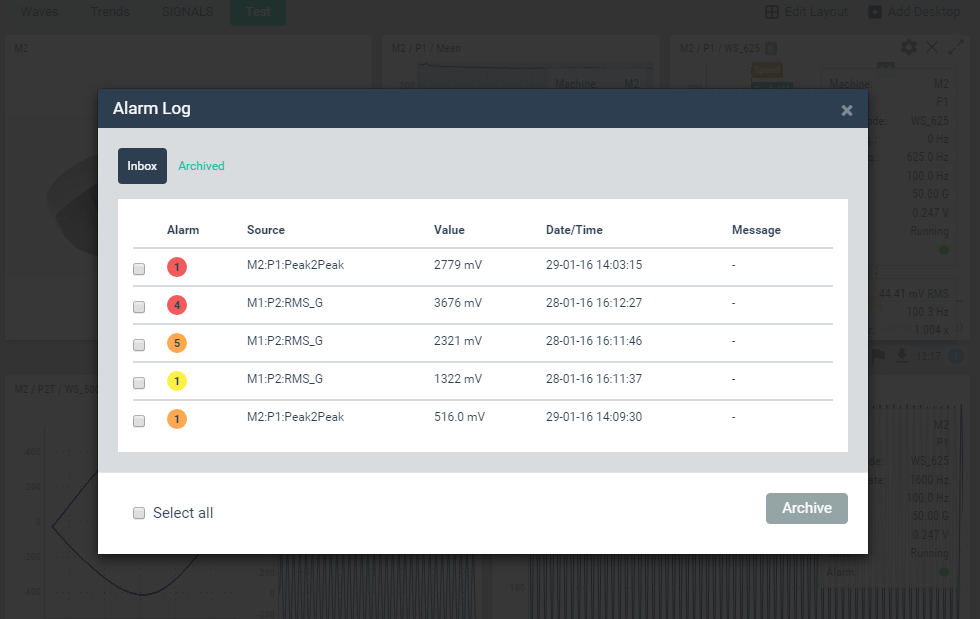
Alarm Log
From any of the desktops the users have access to the "Alarm Log" a tool that shows all the events or anomalies detected in the monitored machine in real-time.
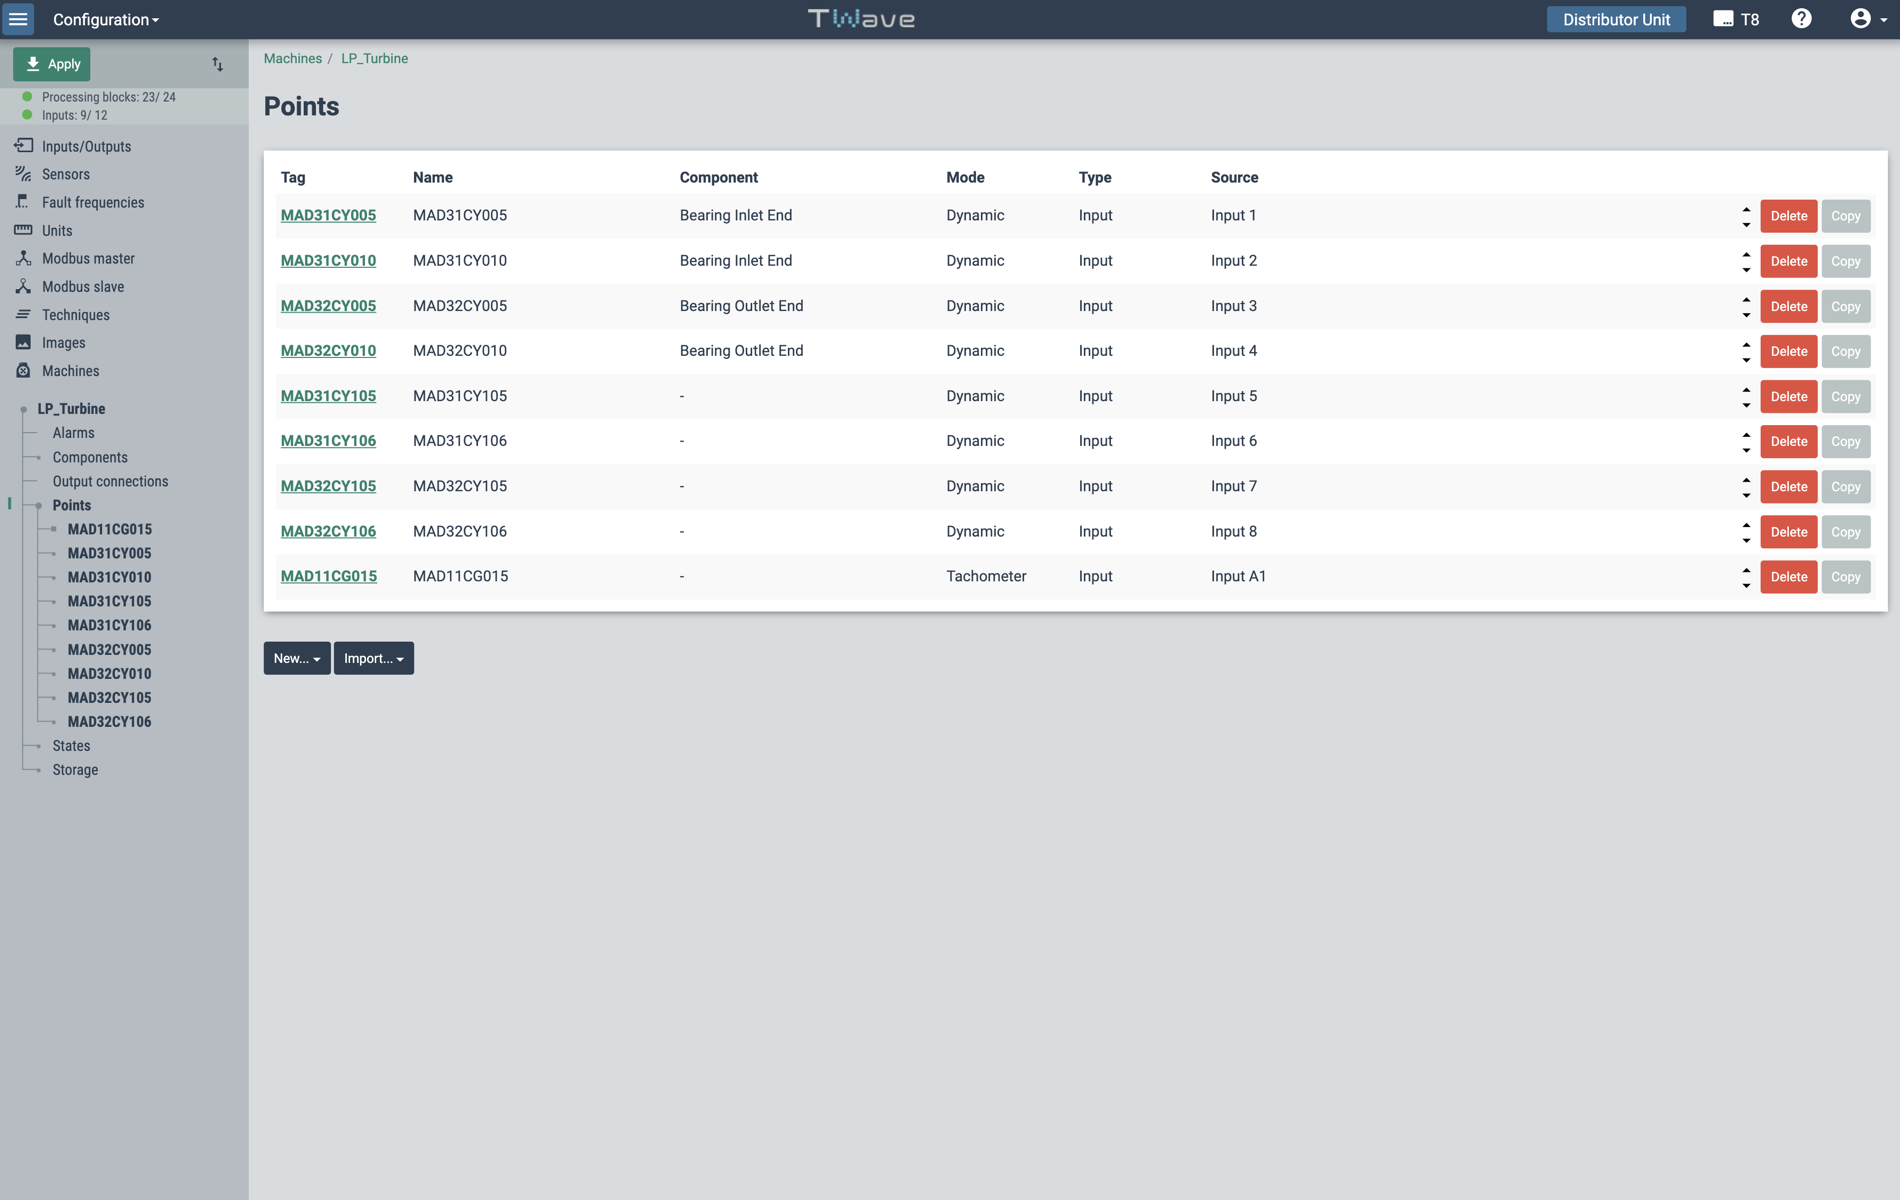
Configuration
TWave T8 includes a web interface to configure all the system options and monitoring features available on the units.
Widgets
These mini-applications plot the data measured by the TWave T8 and provide all the graphical tools required by plant operators and experts in predictive maintenance for visualization and analysis.
With the help of shortcuts, cursors, timelines and zoom tools, the information can be accessed and analyzed in a simple, intuitive and effective manner.


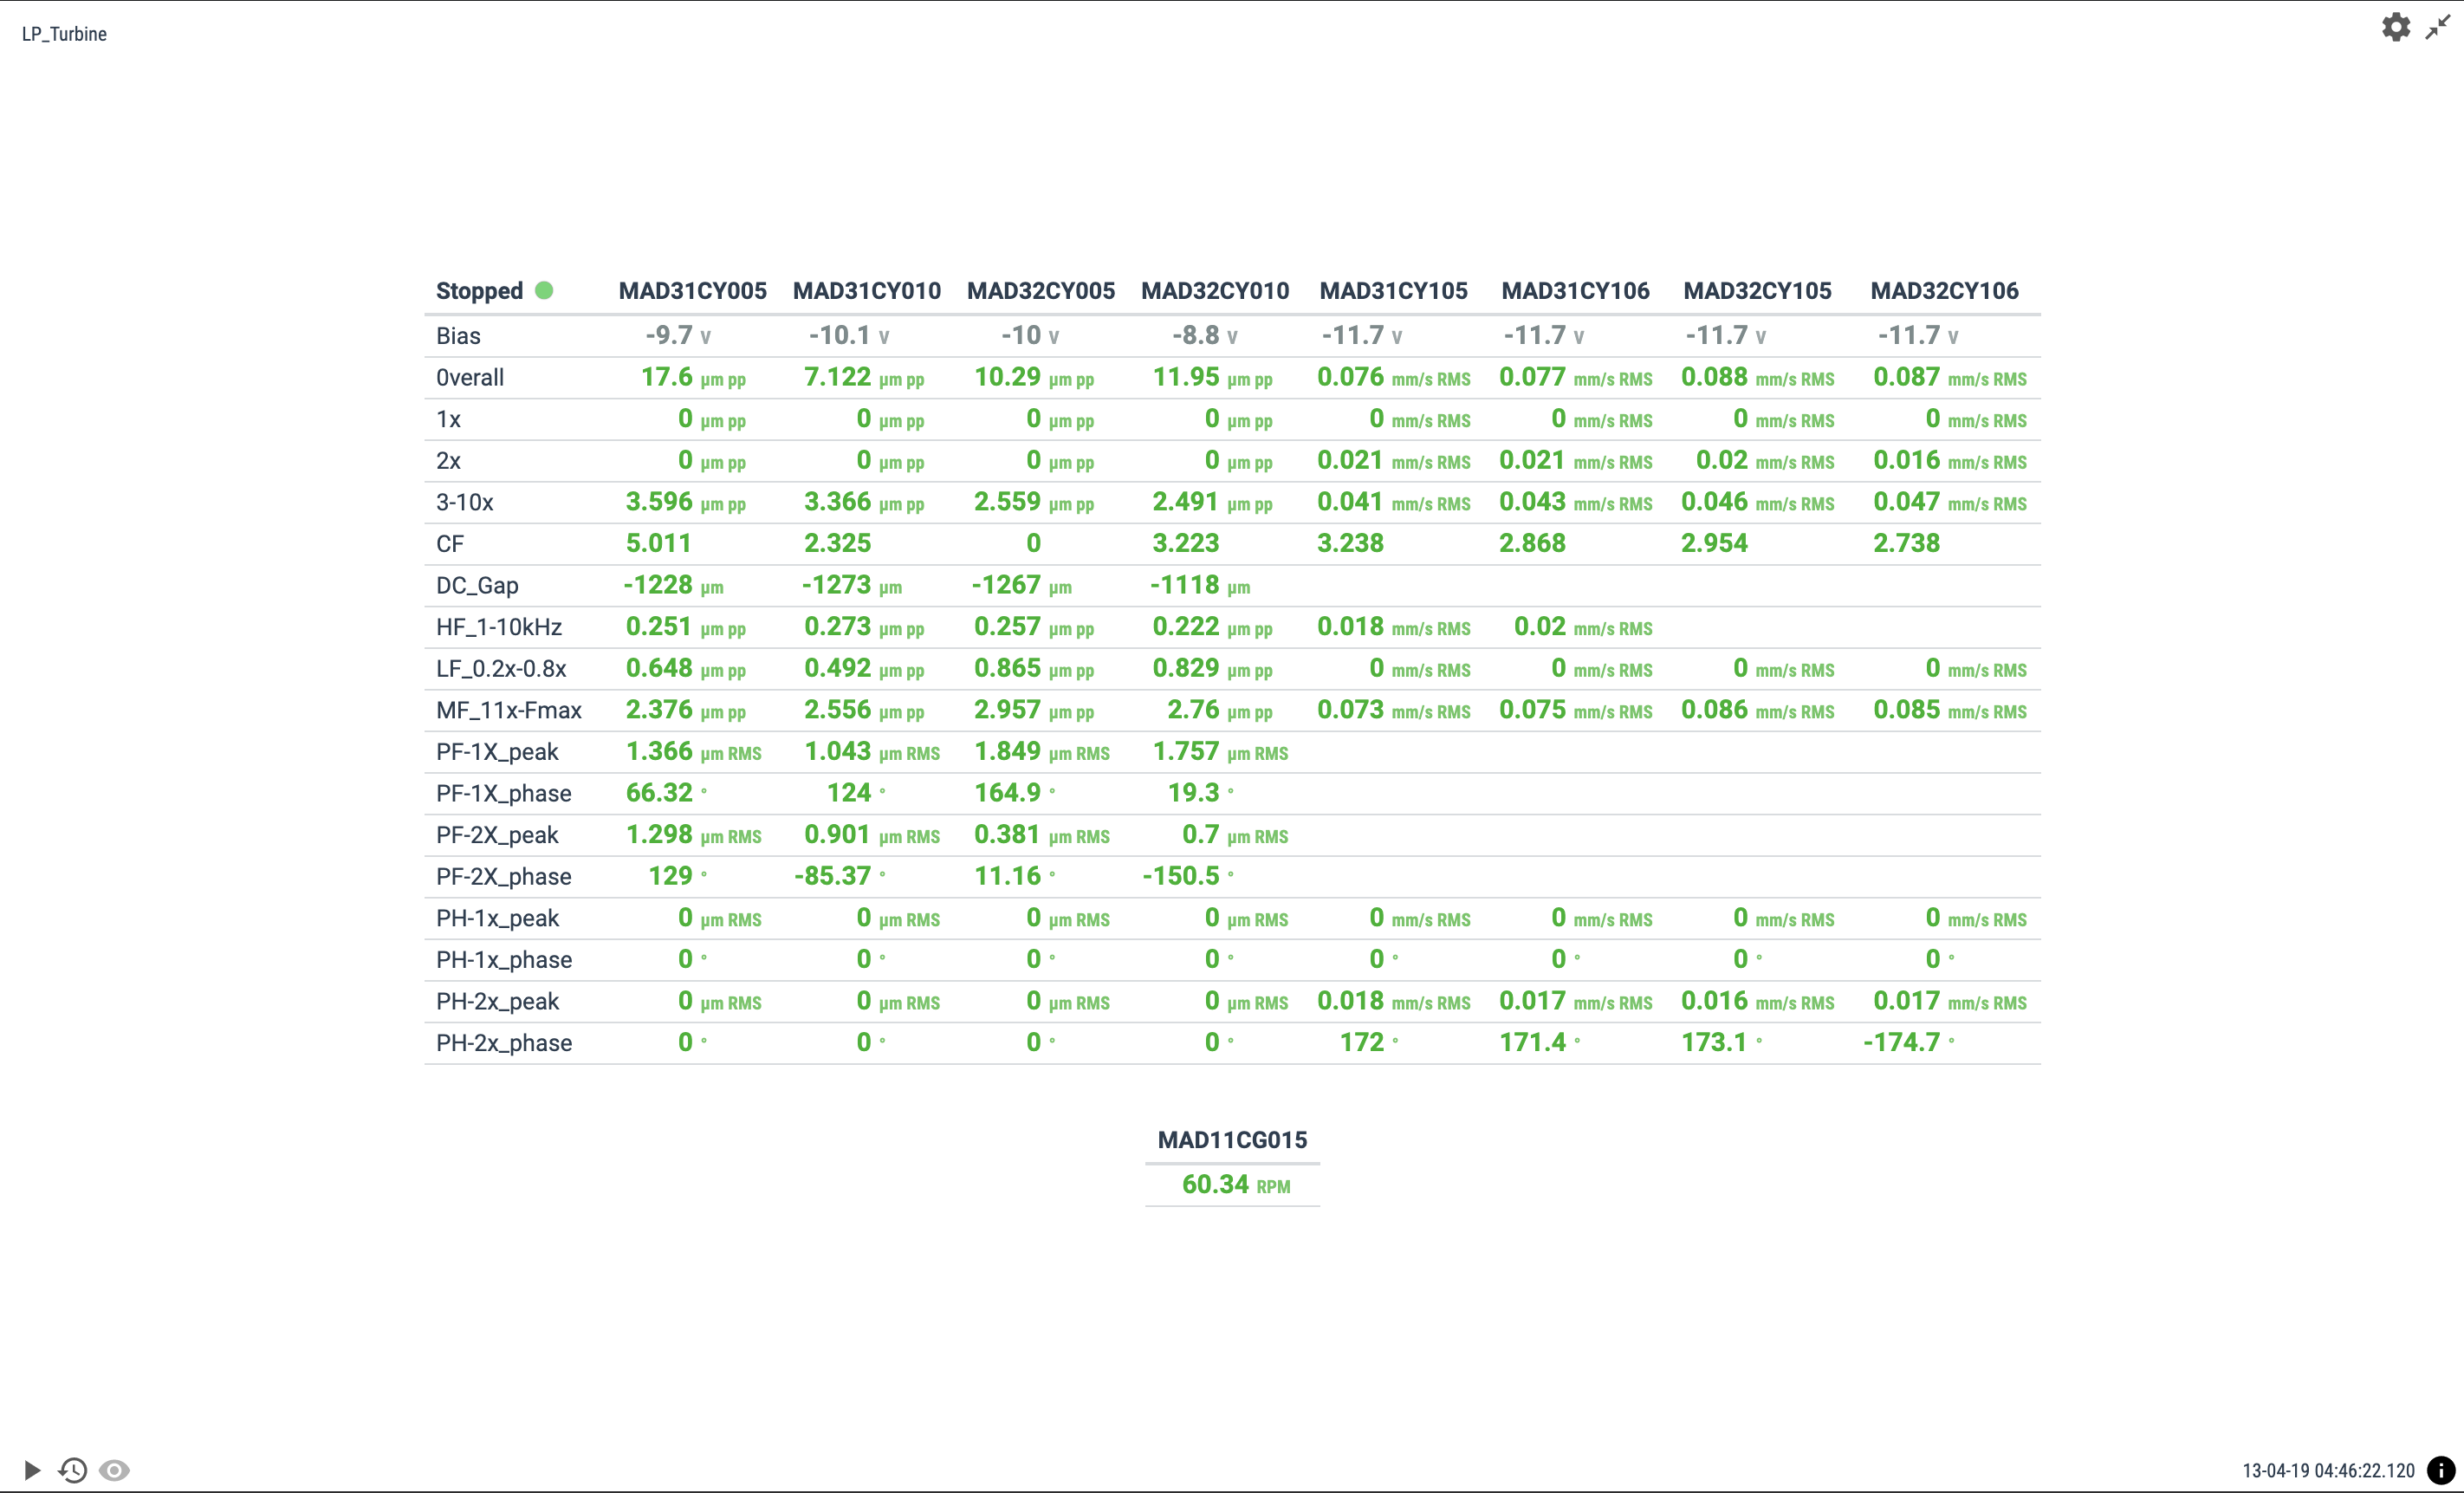
Parameter Matrix
The Parameter Matrix is composed in columns by the different measuring points, and in rows by the different parameters measured on each one, which correspond to the symptom indicators that allow the failure modes of the machine to be monitored.
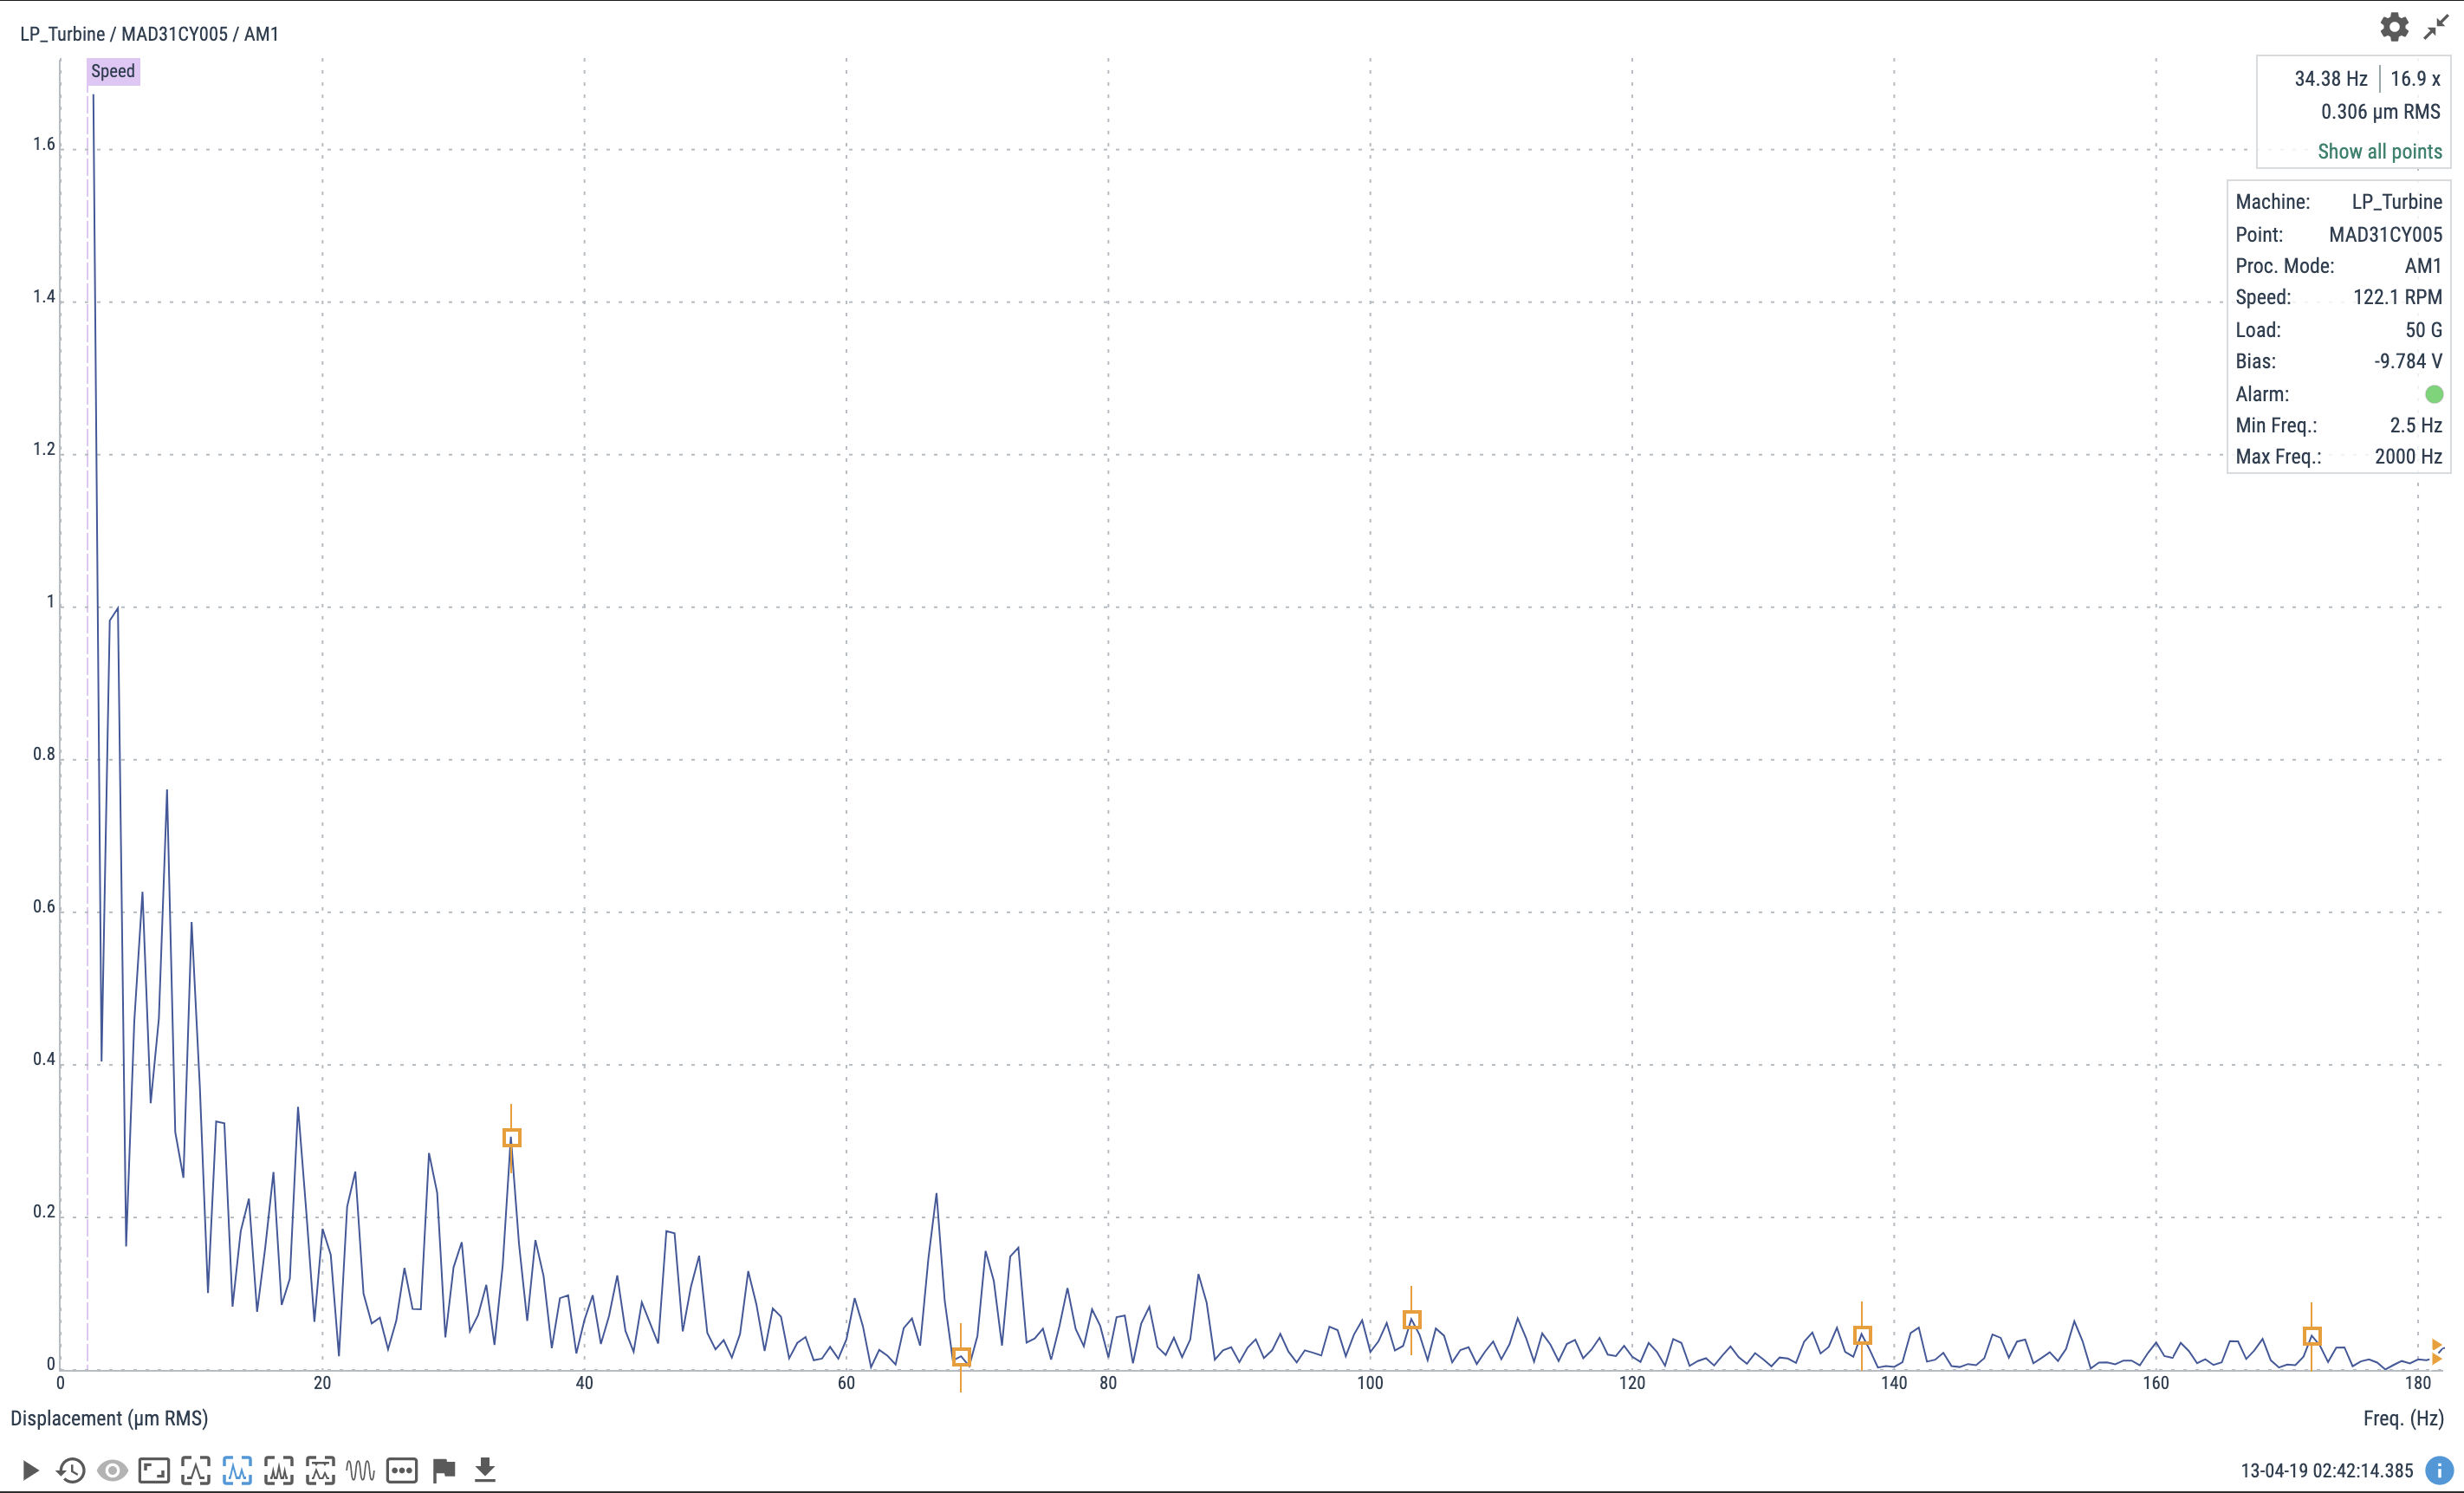
Spectrum
The spectrum brings a lot of information to the vibration analyst about the machine operation state. With the help of the several available cursors (sidebands, harmonics, etc.) it can be used for establishing the right diagnosis.
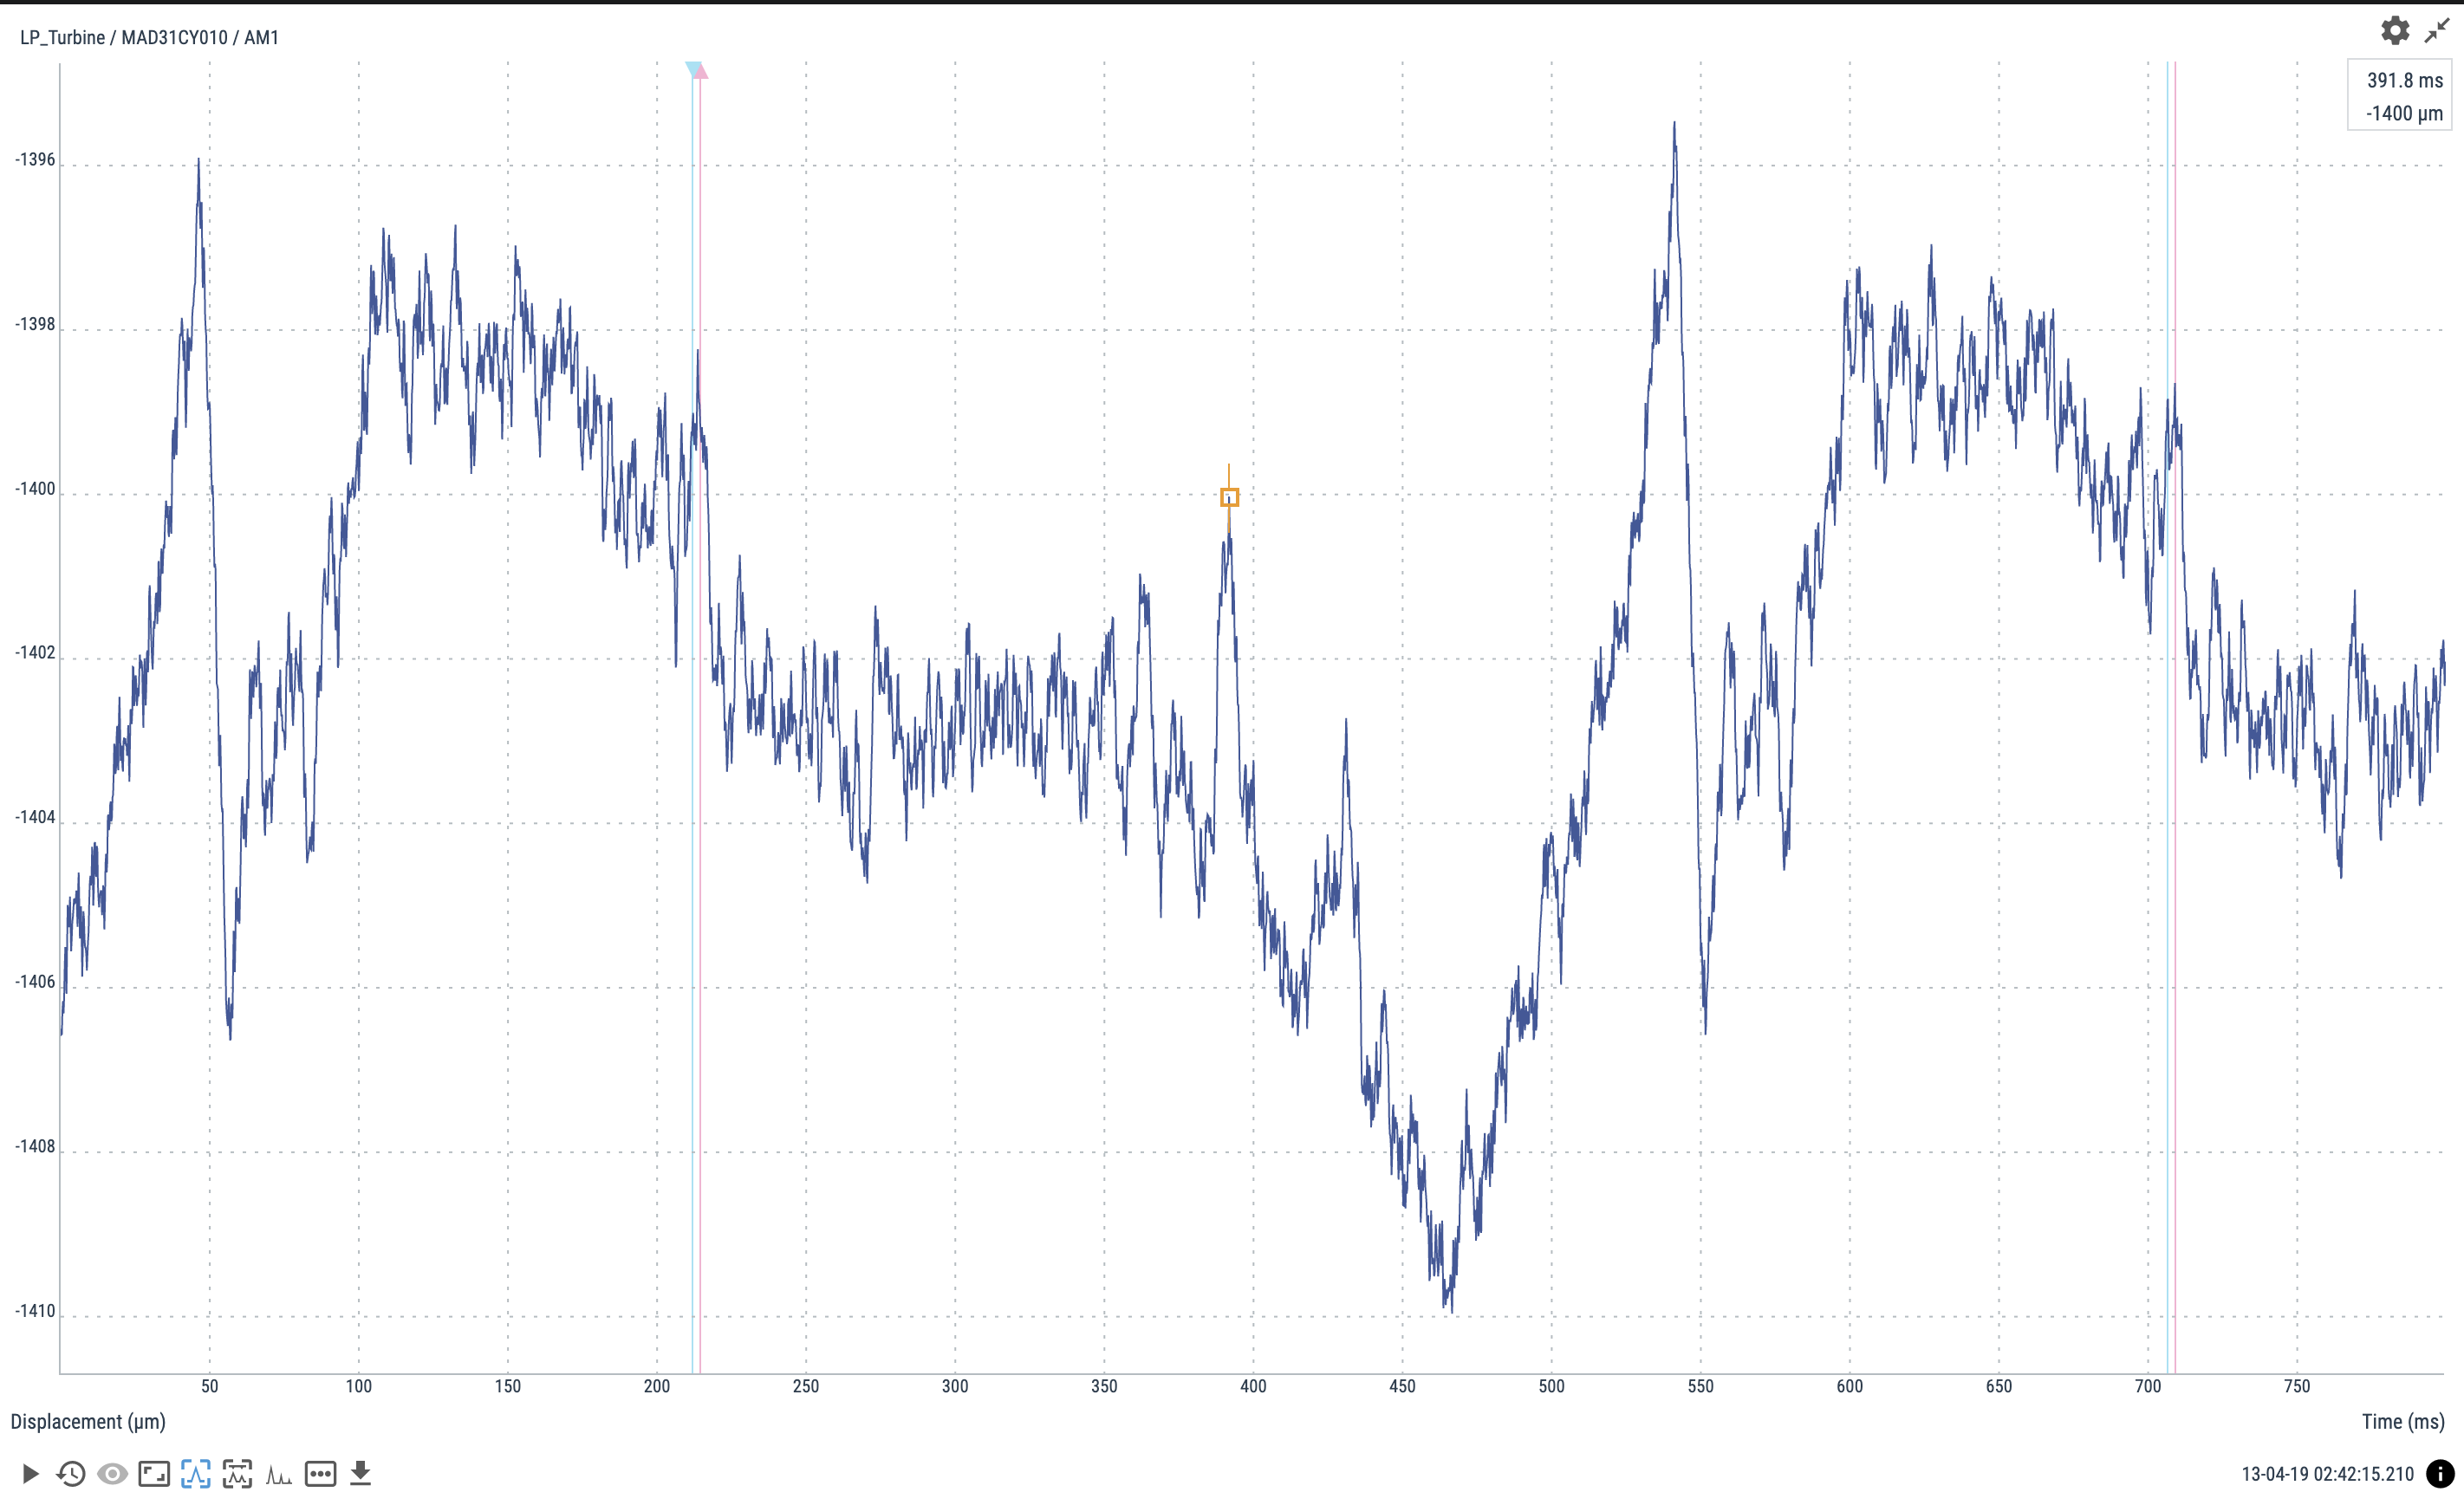
Waveform
The waveform widget displays the original vibration signal collected in each snapshot and can be used to make measurements from it using any of the available cursors.
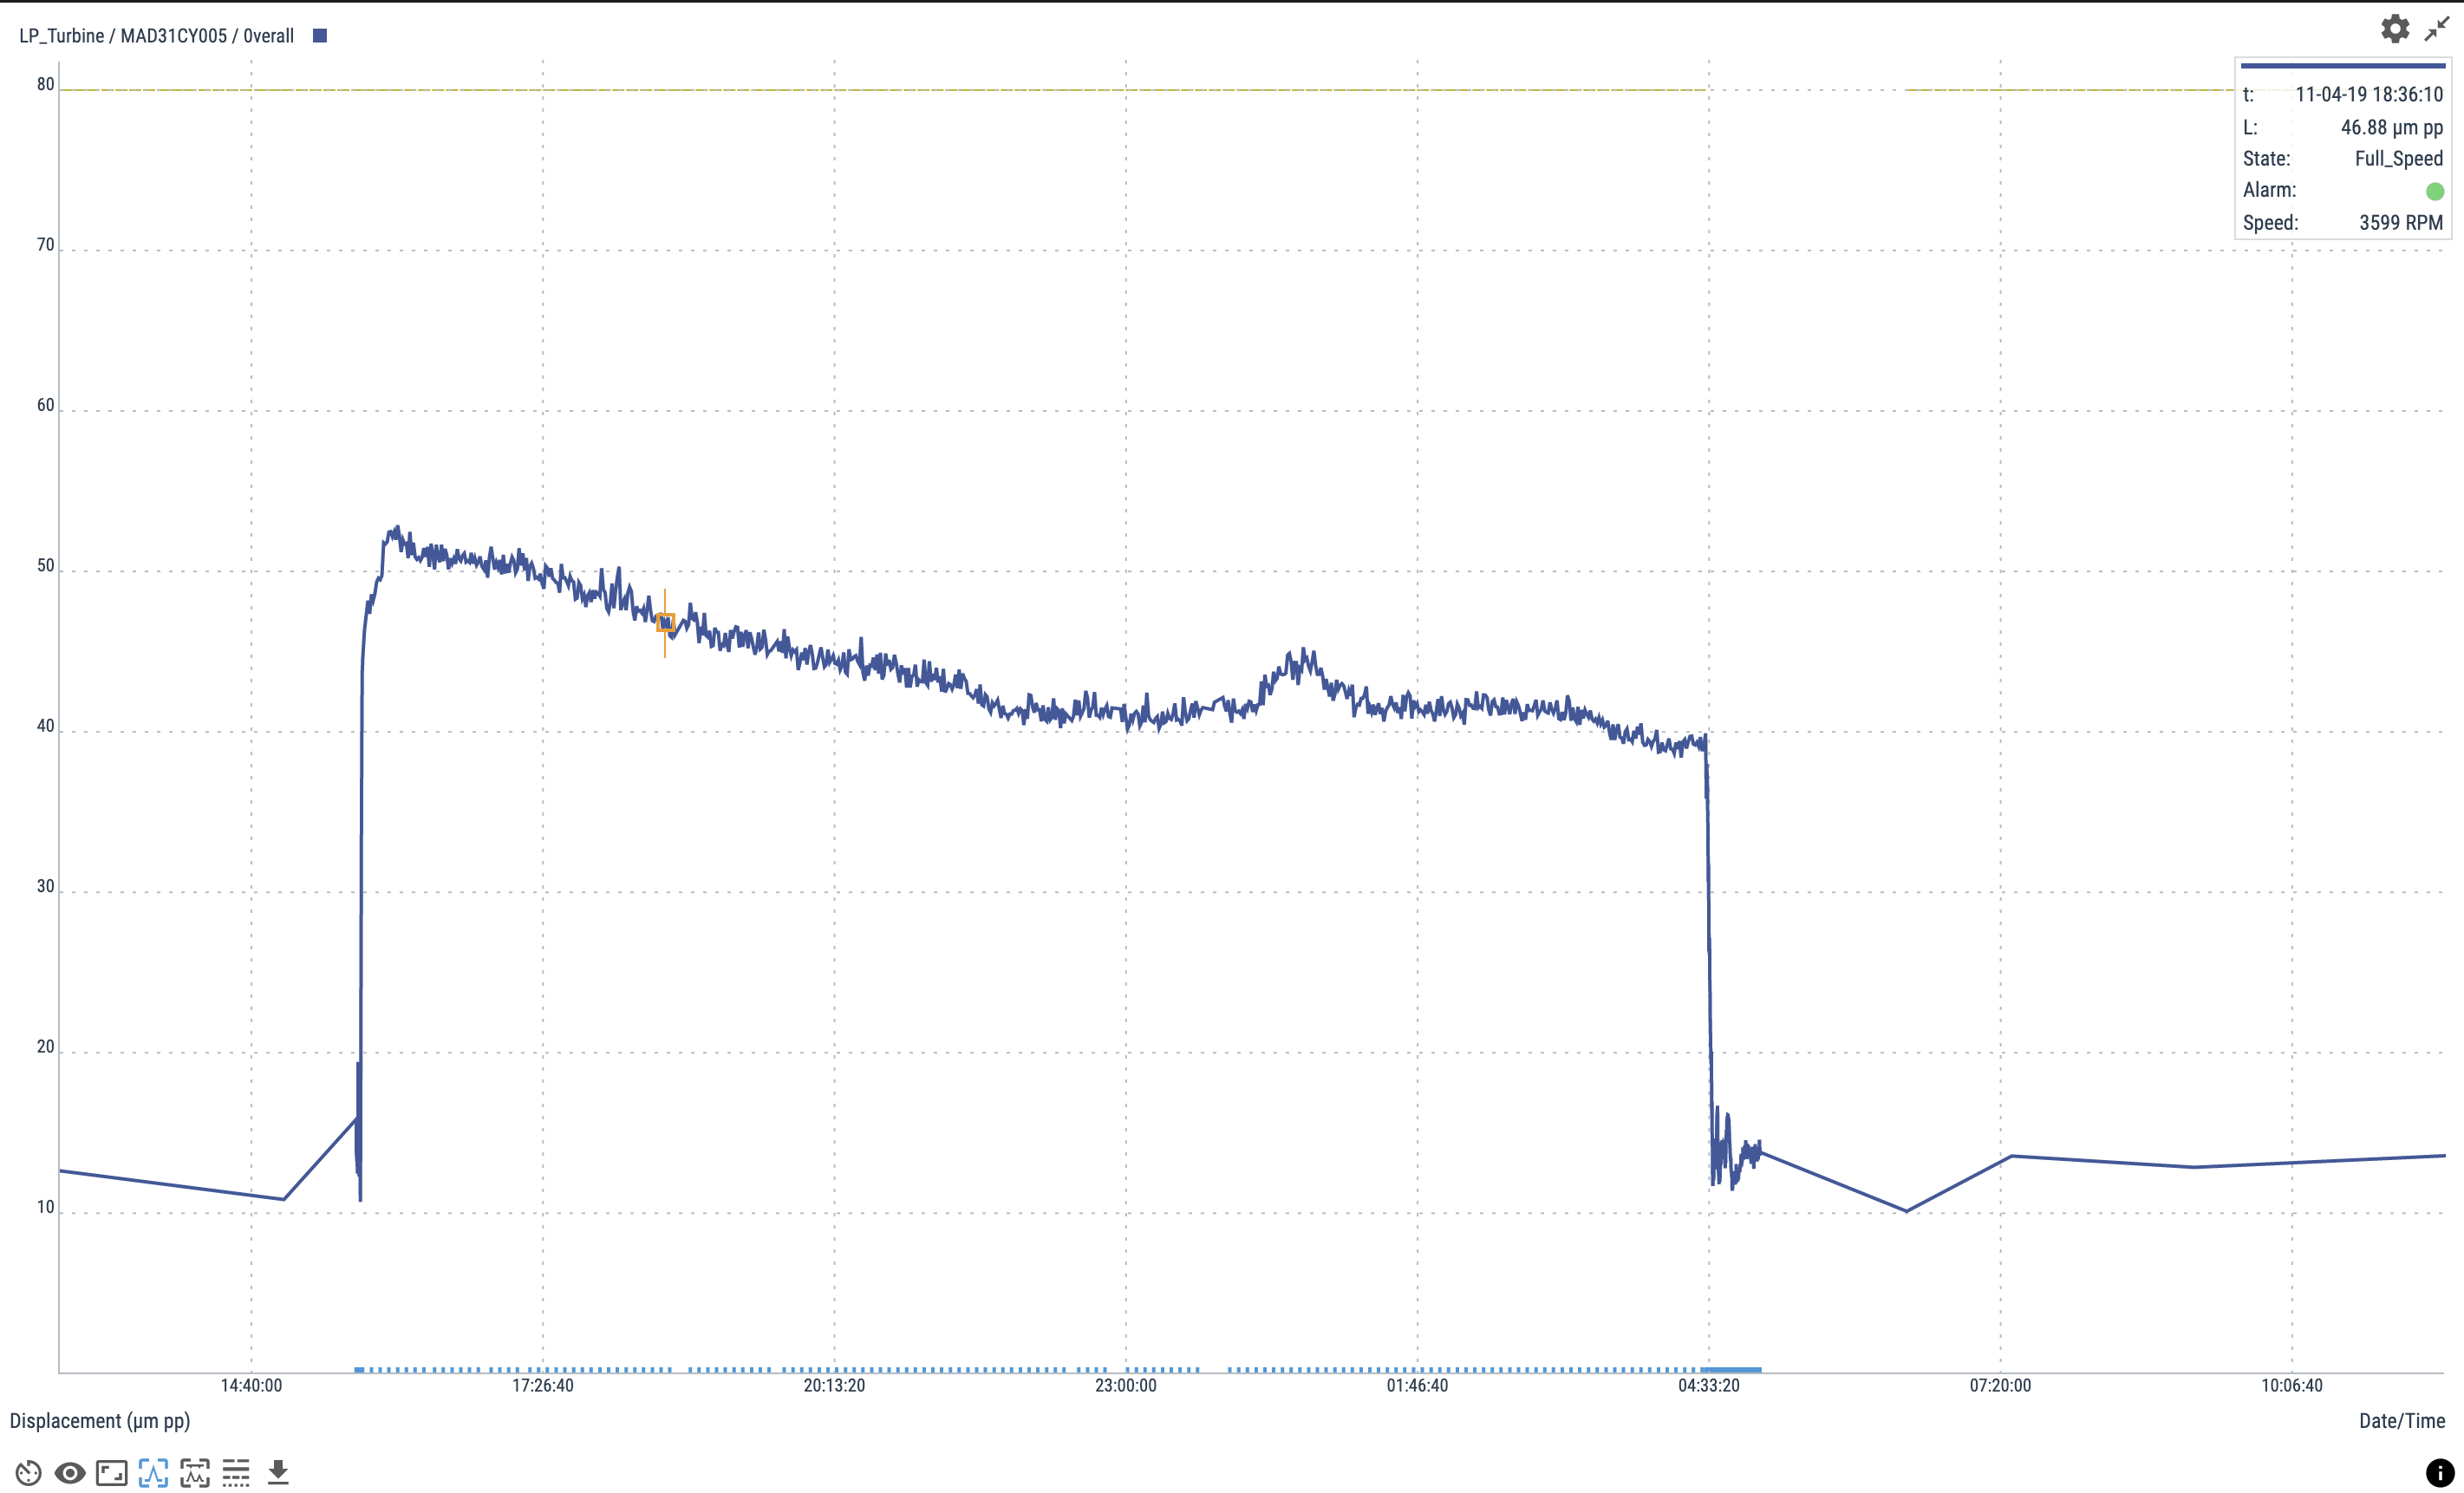
Trends
Trend graphs show continuous indicators for each of the parameters that provide useful information about the status of the machine. They help the user to detect time variations in critical parameters.
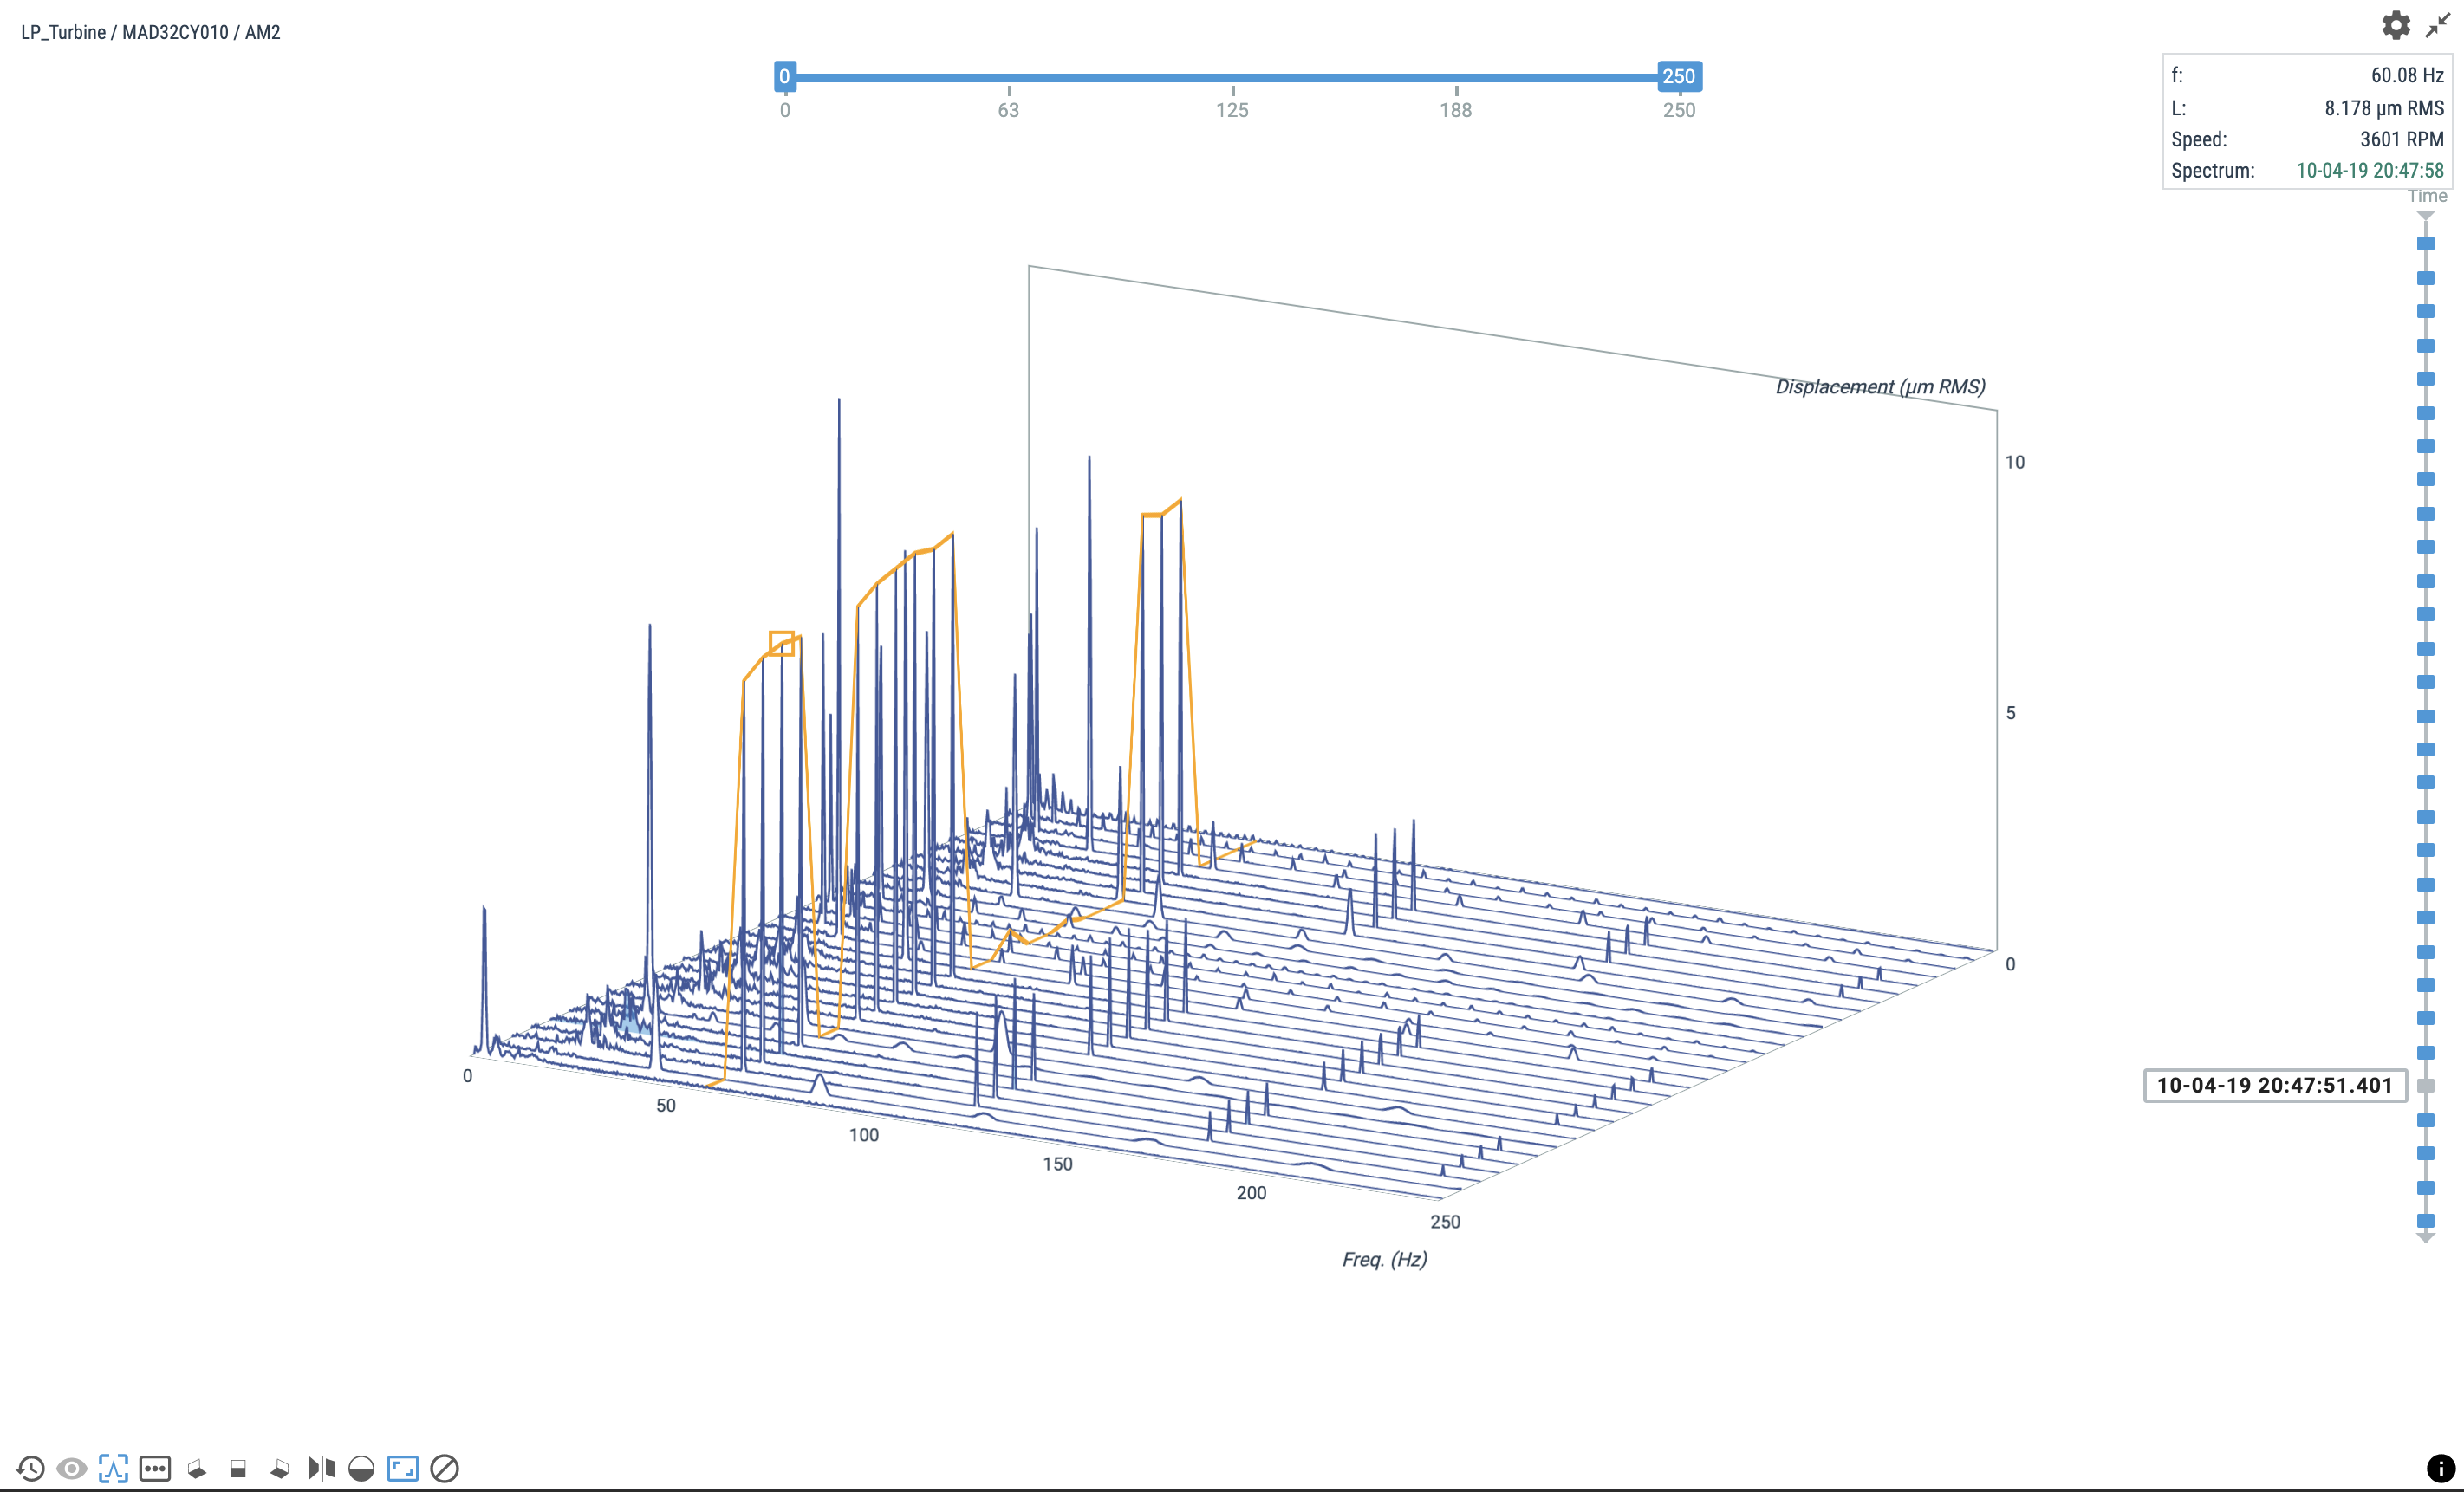
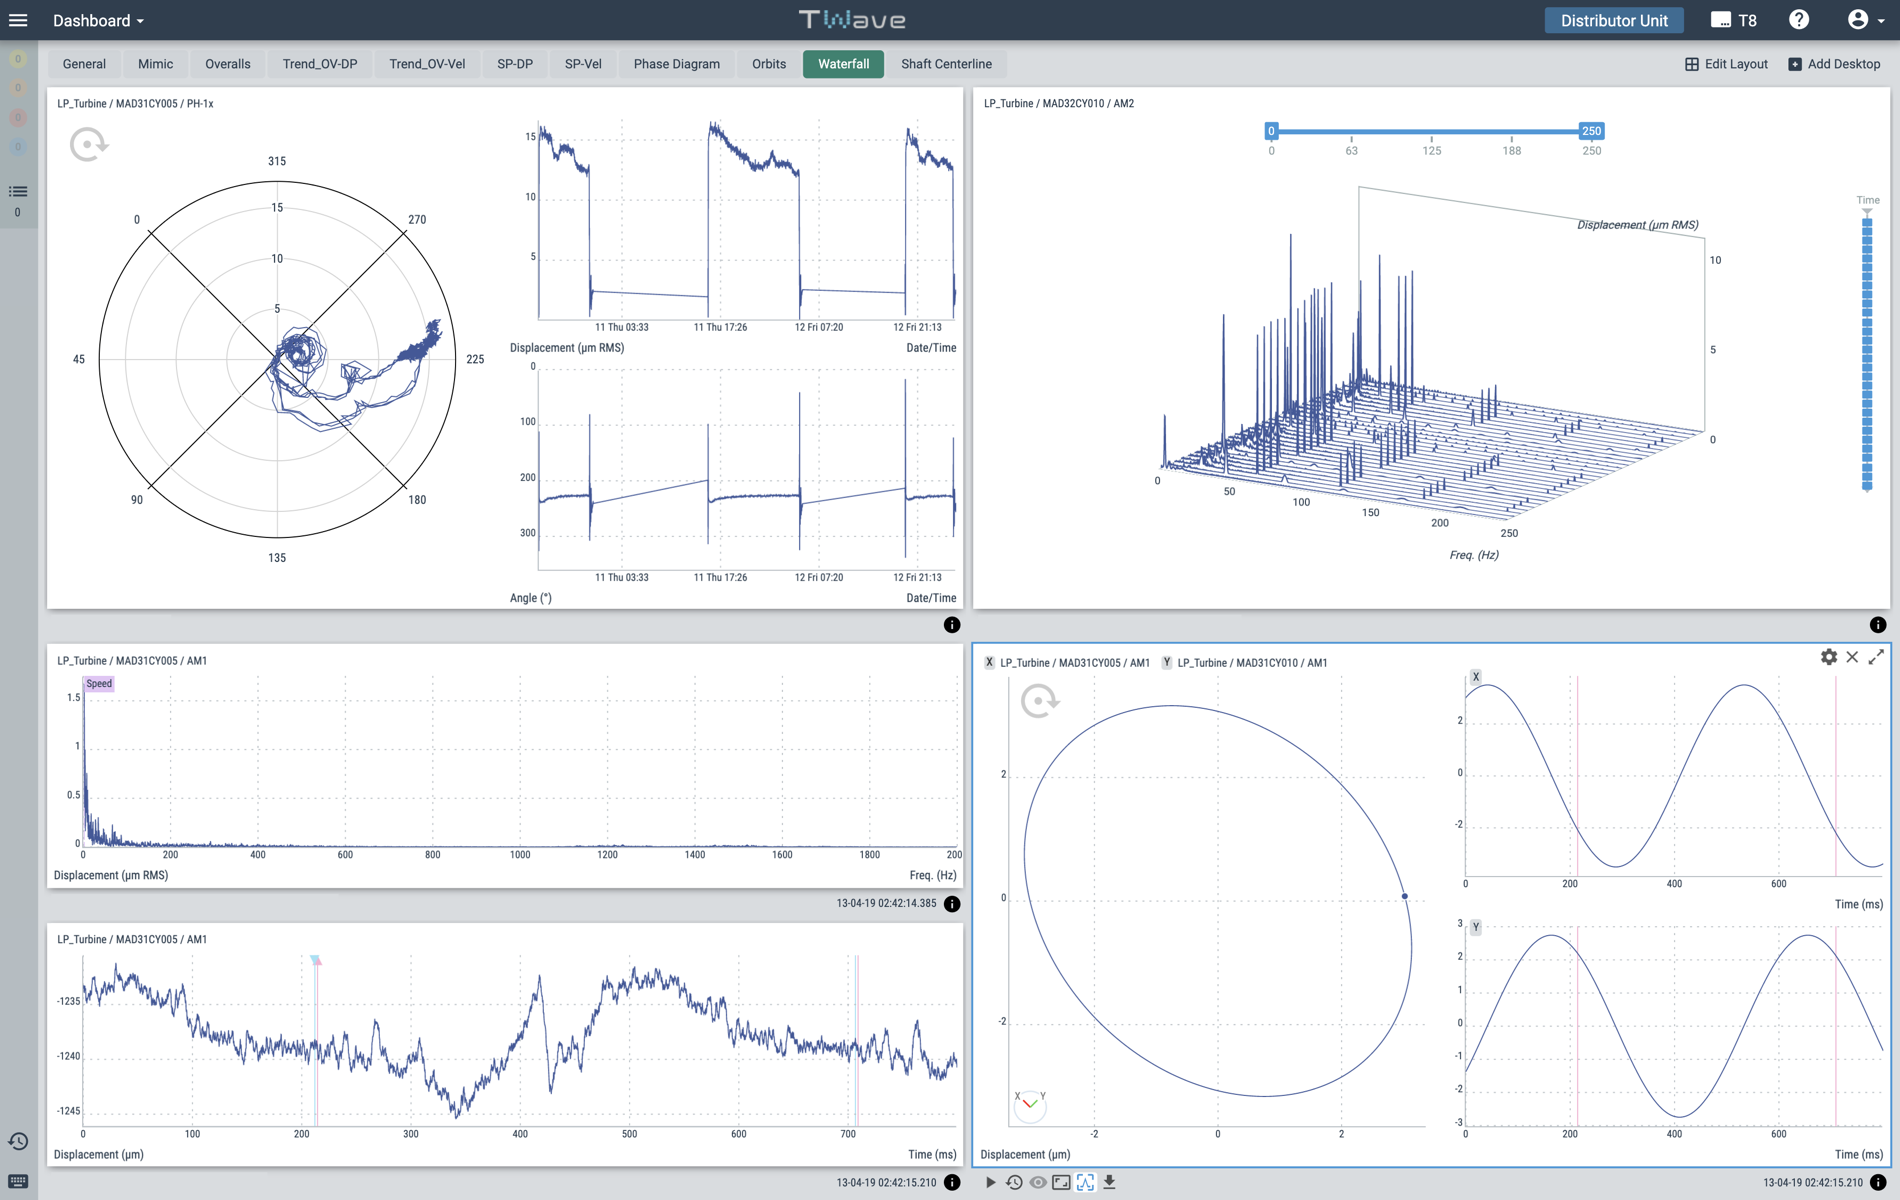
Spectrum Waterfall
The Spectrum Waterfall allows simultaneously multiple curves of data to be displayed. The different spectra are taken at different times but in the same point and with the same sampling configuration. Thus, with the help of this graph, the analyst can detect small changes that have steadily happened in the spectra of the machine.
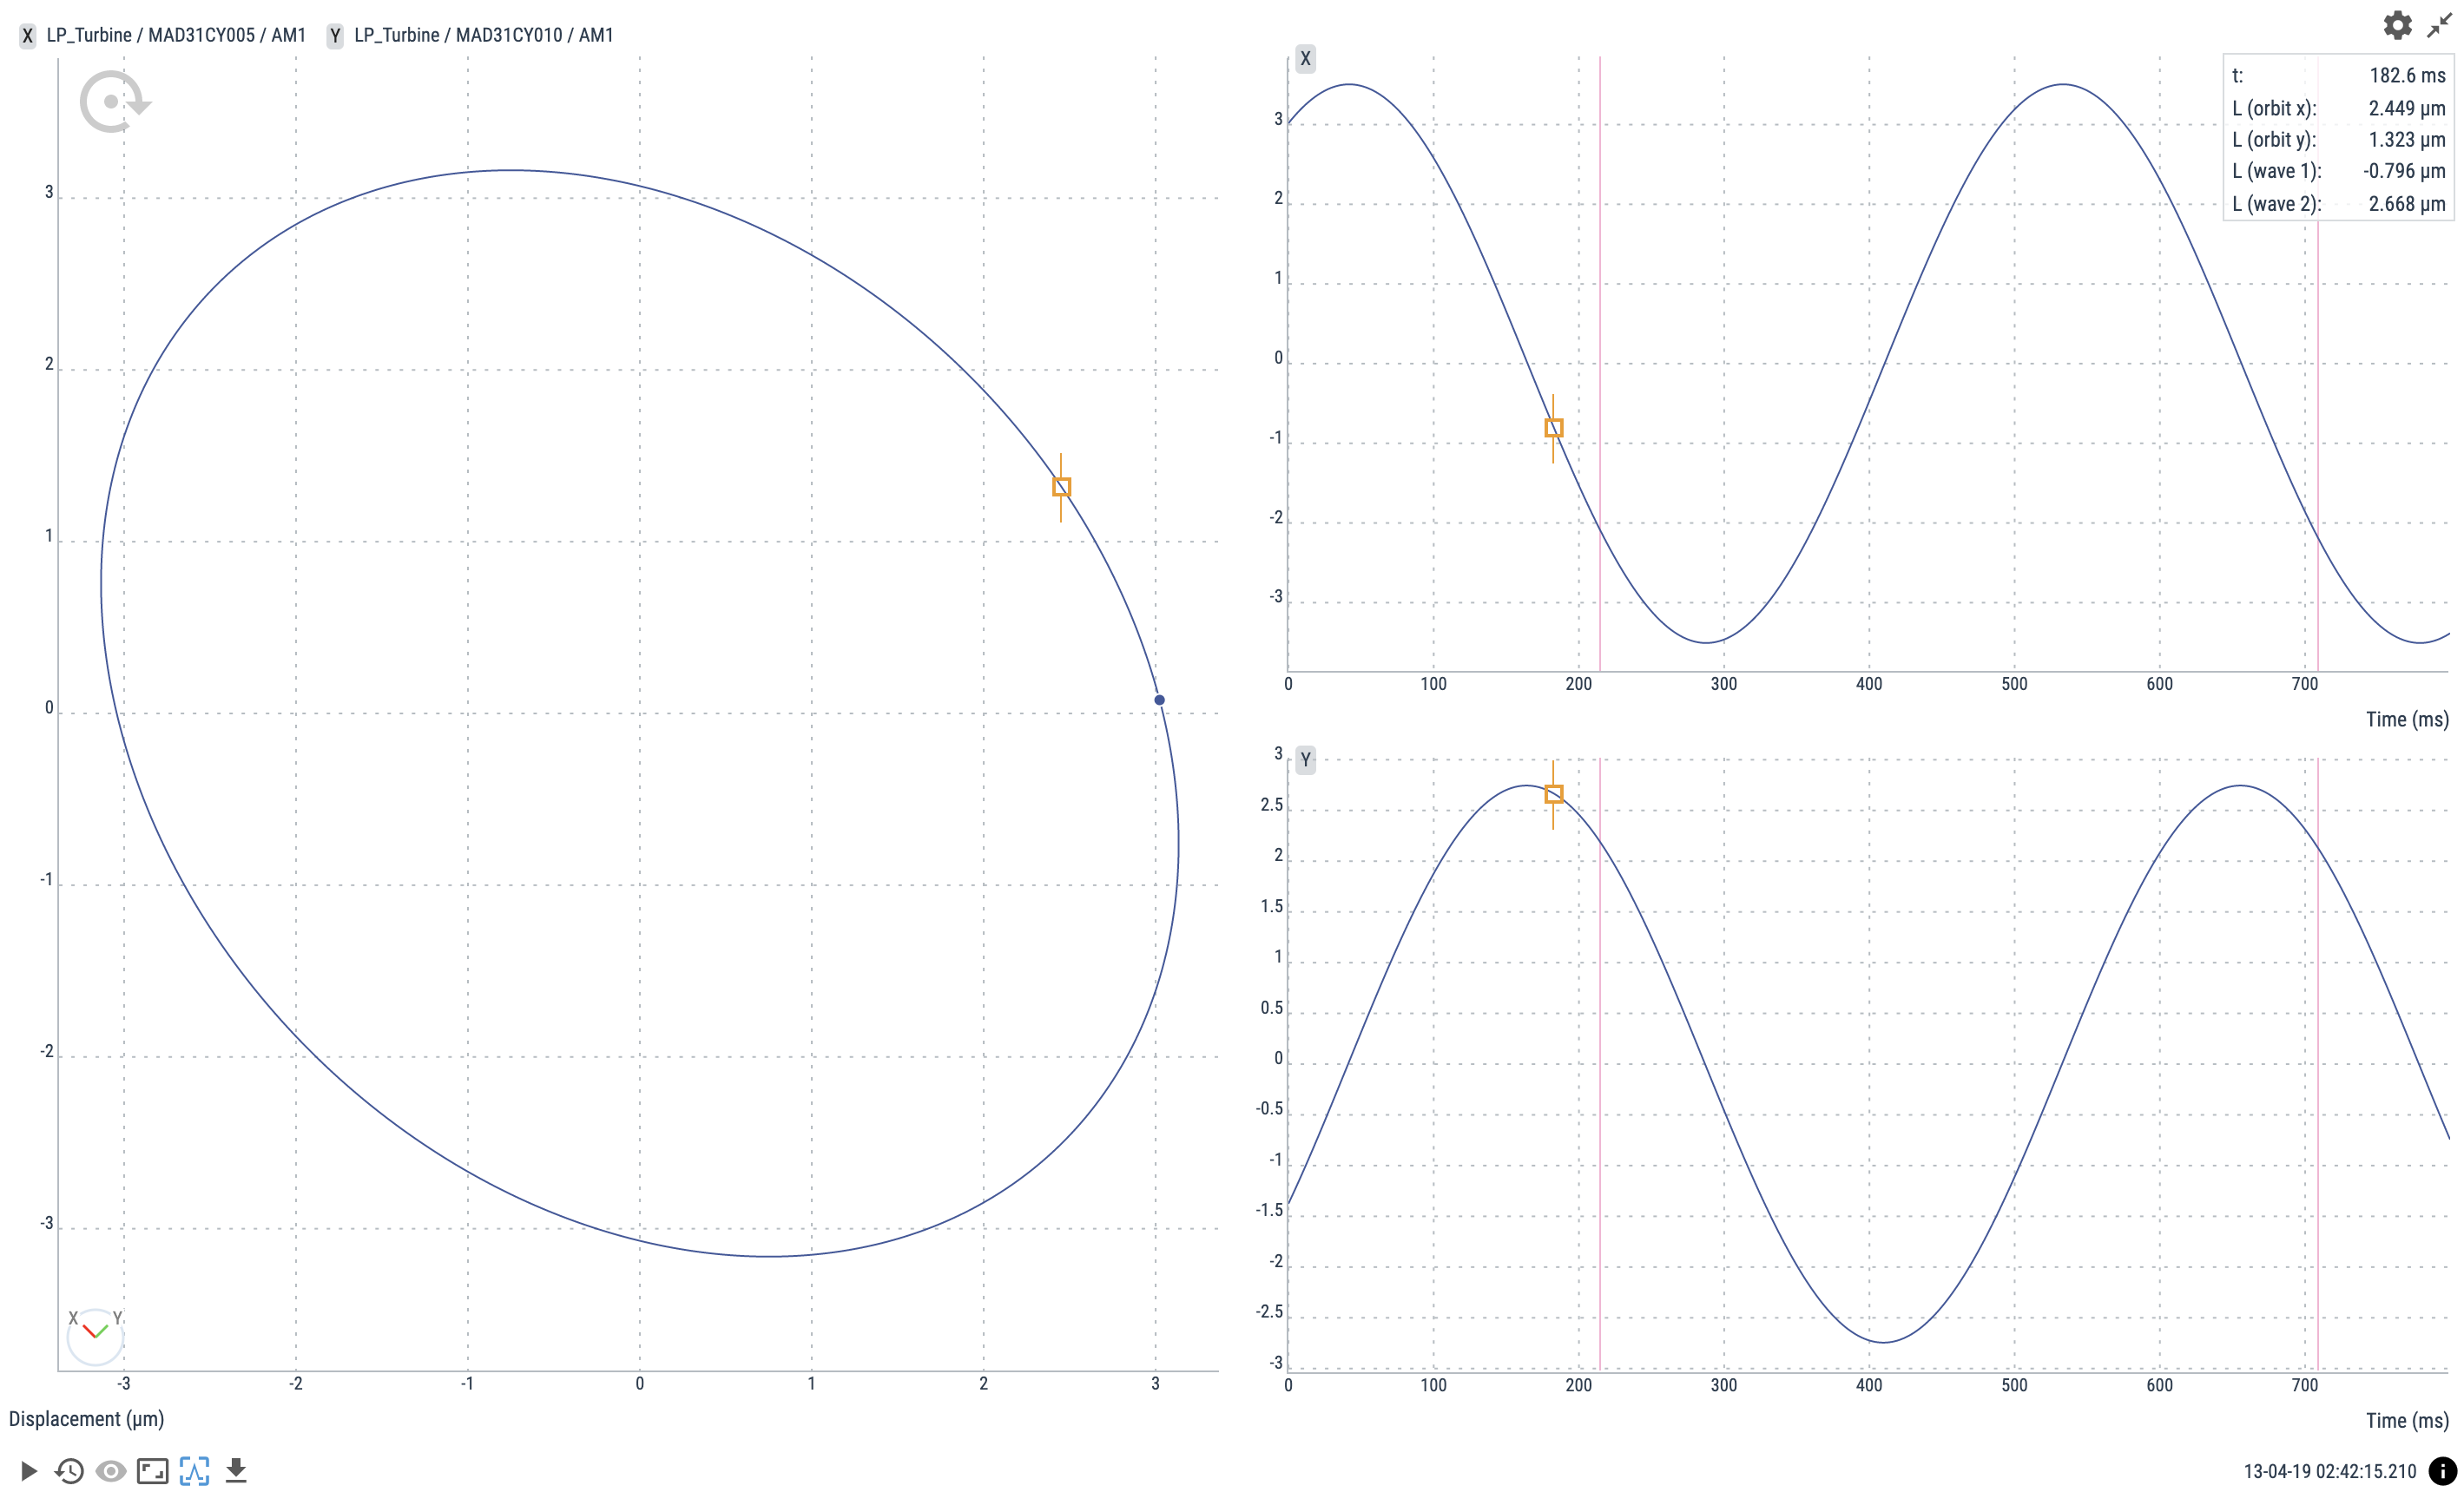
Orbit
The Orbit displays the data of two analog channels, sampled simultaneously, in the time domain. The signals from two channels are drawn on an X and Y plane to display the shaft position change versus the angle of rotation. Orbit displays give a two dimensional visual picture of the motion of a rotating shaft. An ideal well balanced shaft would have no movement in any direction and would produce a dot in the middle of the plot. The shaft movement can give an indication of the vibration source.
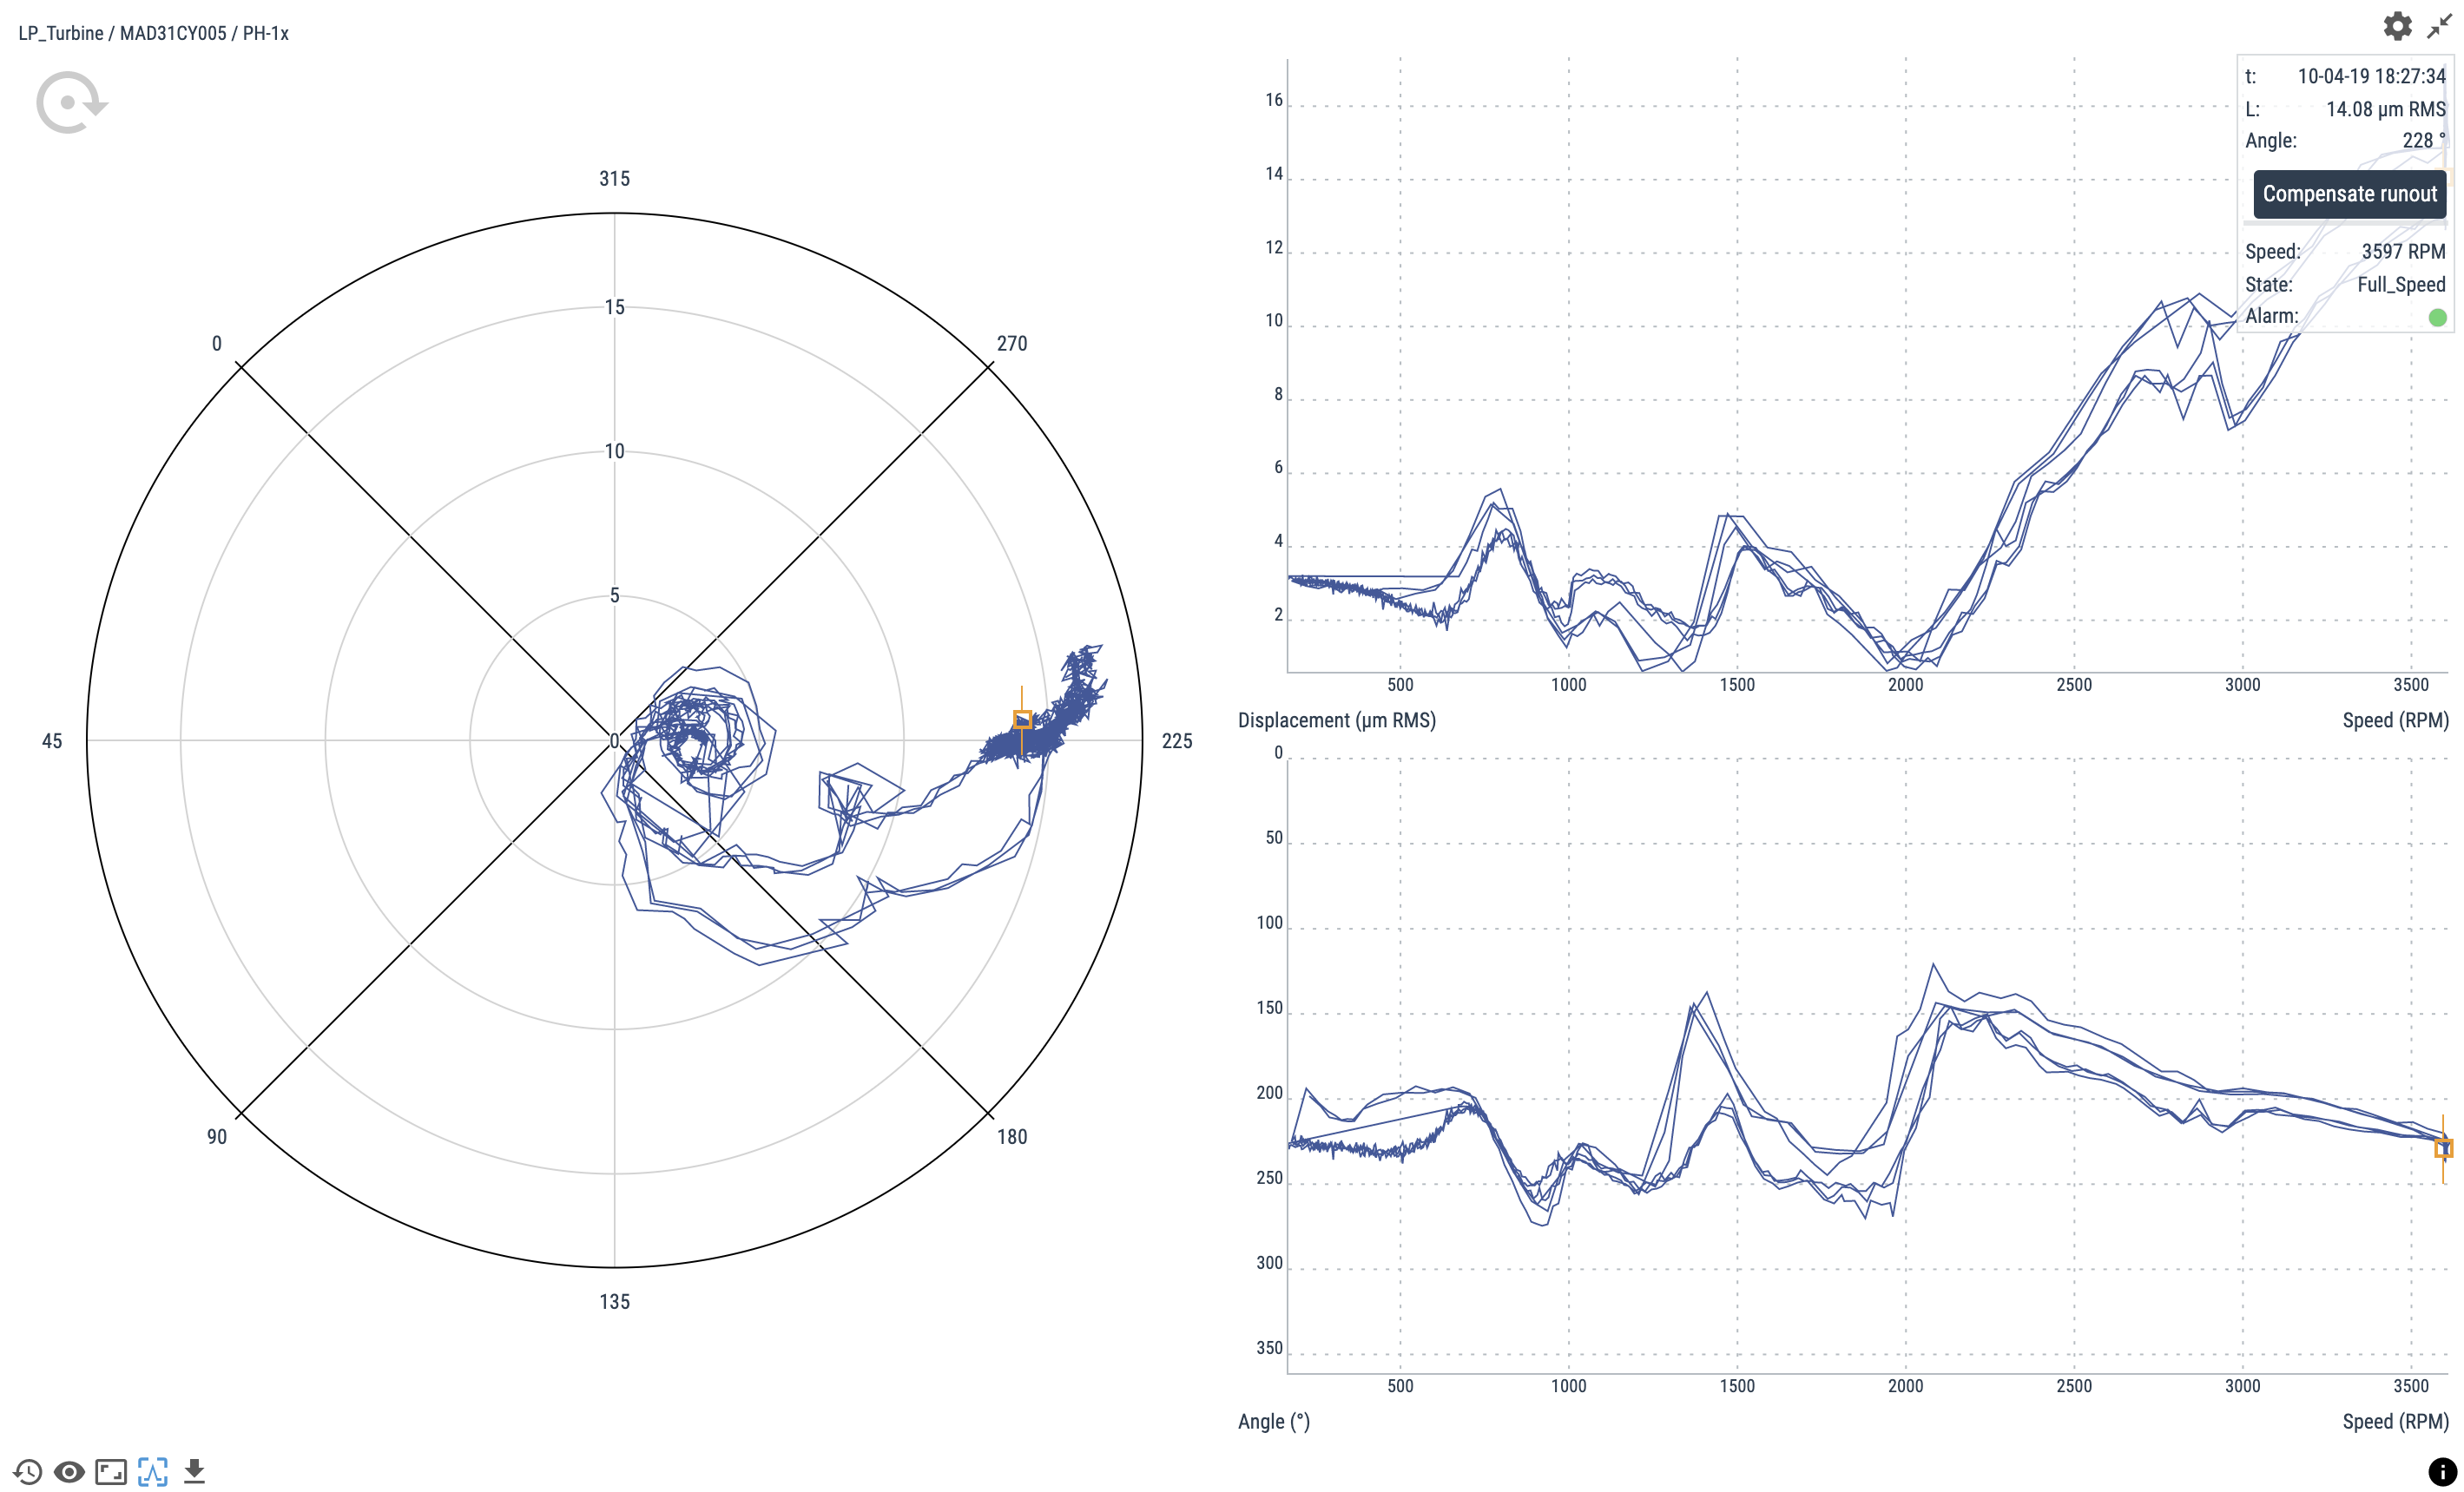
Phase Diagram
Phase diagrams, also called Bode and Polar plots, display peak-phase parameters in different representations. The Bode and Polar representations are combined in the same widget, which can be used to describe a rotational speed vector signal during speed changes. This is typically used for transient (non-stationary signals) analysis, in both run-up and run-down operations of the machines.
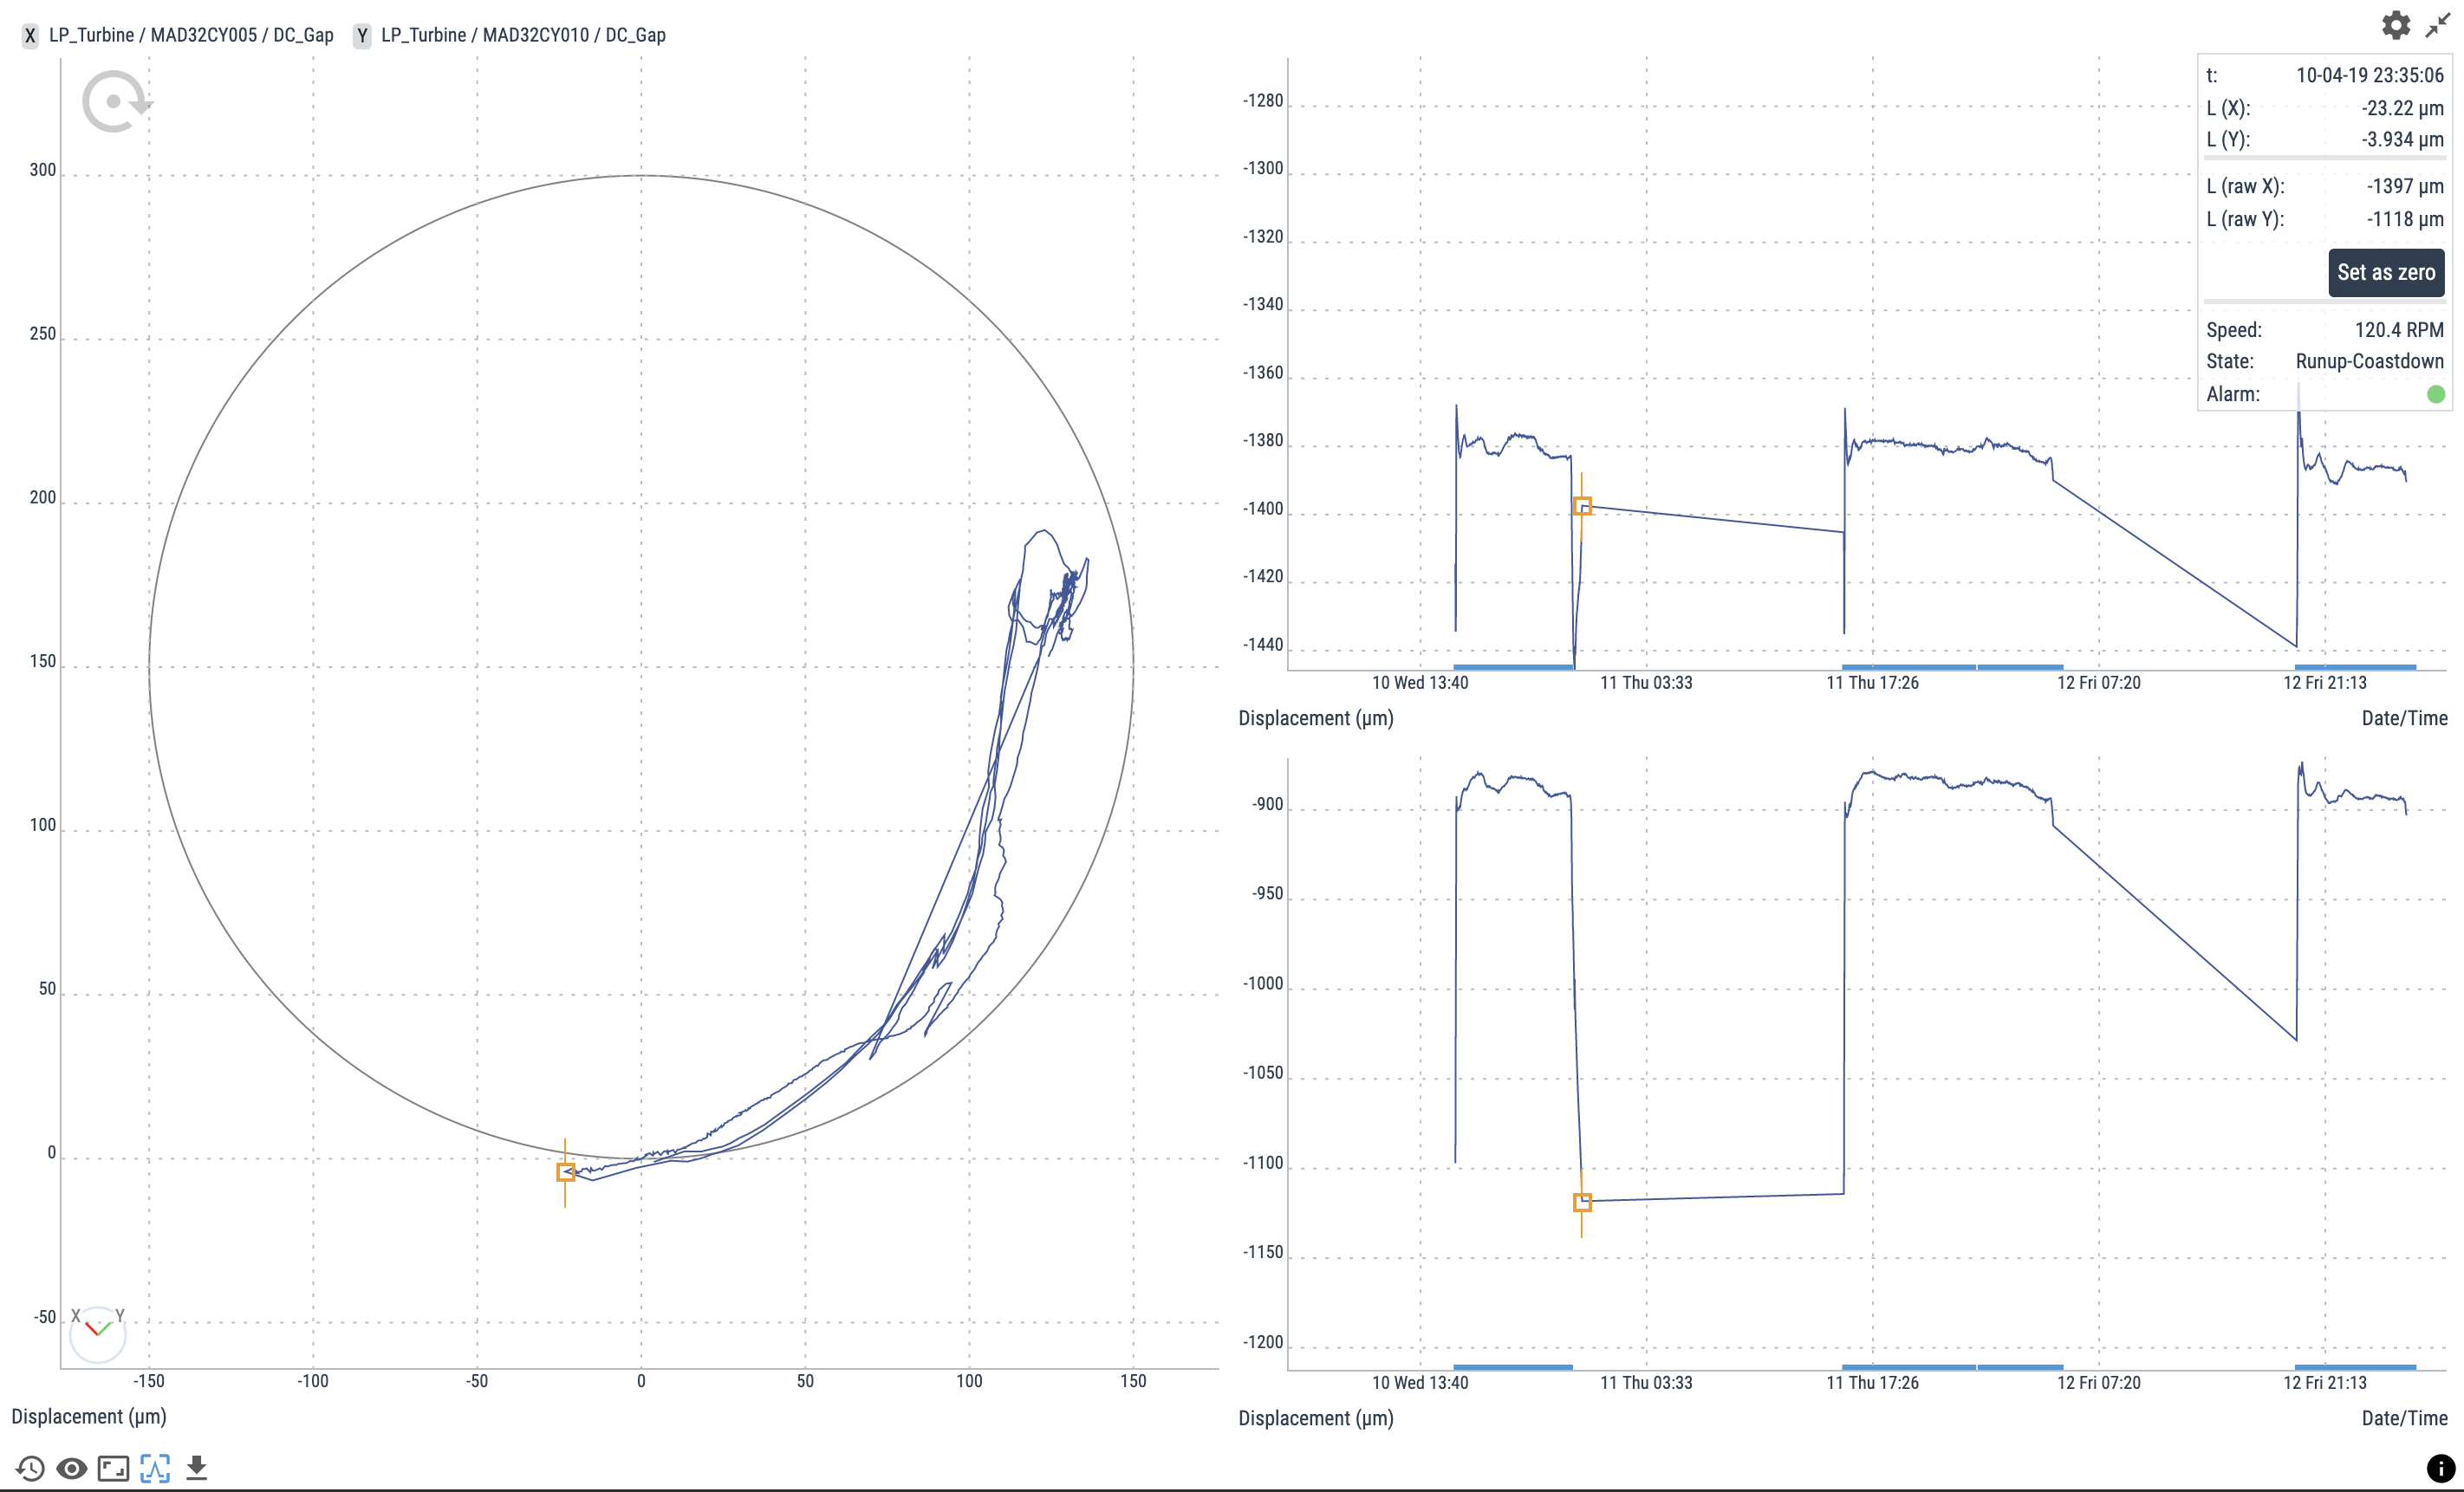
Shaft Centerline
Primary and secondary machinery malfunctions such as misalignment, fluid-induced instability, and rubs, to name a few, can produce significant changes in the rotor’s radial position of a machine within the bearings or seals. These changes in the average radial shaft position can be directly observed via the Shaft Center Line plot.
Specs
TWave T8 is a device designed to meet the conditions of an industrial environment.
Its small size, low power consumption, and simplicity, combined with a high performance and reliability, make TWave T8 a unique state-of-the-art instrument.

Web interface for configuration and displaying.
Flexible storage system based on events and conditions.
Automatic monitoring of failure modes.
Calculated parameters based on user-defined formulas.
Powerful ARM Quad Core processor.
1 Gb RAM.
4 Gb internal storage.
FPGA-based simultaneous processing.
8 analog inputs.
High frequency (51.2 kHz) simultaneous acquisition.
Real-time data acquisition (hardware pre-buffering).
USB host and Expansion Port to plug in additional modules.

